Loading...
Loading...
Loading...
Loading...
Loading...
Loading...
Loading...
Loading...
Loading...
Loading...
Loading...
Loading...
Loading...
Loading...
Loading...
Loading...
Loading...
Loading...
Loading...
Loading...
Loading...
Loading...
Loading...
Loading...
Loading...
Loading...
Loading...
Loading...
Loading...
Loading...
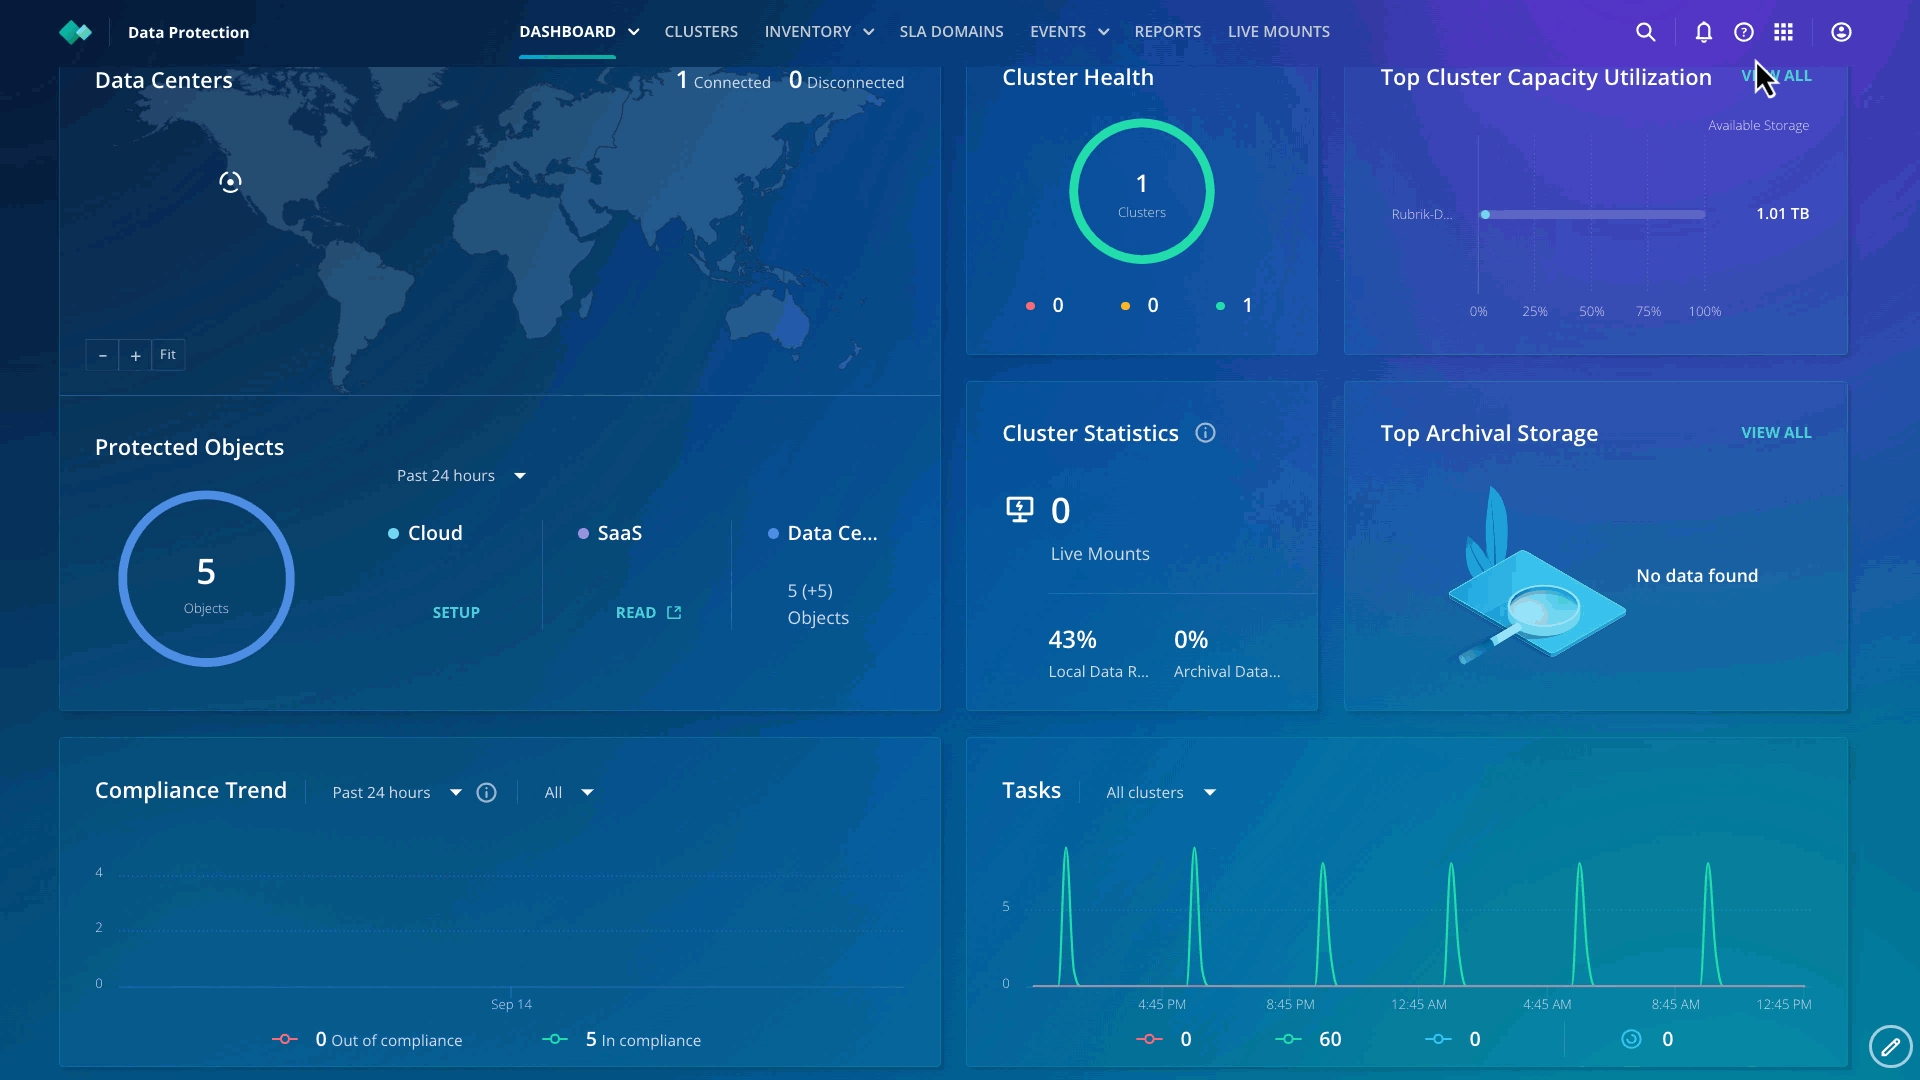
Now that your environment is up and running, you can use Data Security Command Center to determine whether your data is safe and protected by evaluating the score on the DSCC dashboard.
Loading...
Loading...
Loading...
Loading...
Loading...
Loading...
Loading...
The SecOps team wants to understand the blast radius of the attack. Currently, they can't figure out when the attack started, which applications were affected, and if there is a clean copy to recover from.
You have access to the Rubrik Enterprise edition, so let's start with Anomaly Detection to see how you can help the SecOps team.
As Rubrik collects each backup snapshot’s metadata, it leverages machine learning to build a perspective of what is going on with the workload. The model is trained to identify trends that exist across all samples and classify new data by their similarities without requiring human input. The result is that Anomaly Detection detects anomalies, analyzes the threat, and helps accelerate recovery with a few clicks.
Anomaly Detection is available in the Rubrik Security Cloud as an application.
If you haven't already connected to the Rubrik Security Cloud, head back to the lab environment.
Once you're logged in, click the app-tray icon in the top right of the user interface, then select Data Threat Analytics.
Phew, all the workload migration is completed, workloads protected, blueprint setup done! A lot of achievements for the day so far! Oh, call from the Ops team. What is going on?
Anomaly Detection has a dedicated page that lists potential anomalous incidents with their location, cluster, file details, and snapshot time. If you have Cyber Recovery (discussed in a later section) enabled, objects that are part of a recovery plan will be grouped under that recovery plan.
By looking at this page, you now have an understanding of which systems and applications have been affected by the cyber attack.
Now, let's dive deeper into which folders and files are impacted.
From the Anomaly Detection dashboard, you can see the critical events that were discovered over the past 24 hours. The Status card displays the number of anomalies detected in the last 24 hours on the top-left row.
Depending on how long ago the labs were pre-provisioned, the Anomaly events may not be visible in the Status section.
Next, on the top-right row, the Pipeline card displays the overall success of backup, indexing, and analysis jobs in the last 24 hours. You can click on each job type to view details on the Events page.
The File Analysis and Data Analysis cards give you an overview of the systems, files, and amount of data impacted by the cyber events over the last seven days.
Without any deep introspection, you now know the scope of the problem in the production environment. Let's dive in, and get more granular.
Click on the Investigations page in the banner on the top.
Having access to this kind of information is invaluable. Keeping track of all the anomalies in your environment means that you can take the actions required to find the location of the anomalies and use clean snapshots to recover from the anomalies. There are multiple options for recovery, which we will discuss in the next section.
Expand the Haverford_site recovery plan and click on haverford-webapp-01 VM.
Expand the Suspicious filter from the left side and select Suspicious as the file type.
Browse and see exactly which files and folders have been affected. In this case, drilling down to var > www > html > wp-content > plugins.
You can now see that there are several files that have been encrypted.
Now that you have determined the blast radius, we can proceed to recovery.
Without the Anomaly Detection, it would be a "needle in a haystack" exercise to figure out what systems, files, and folders were impacted and where the clean recovery point will be.
Many ransomware recovery plans are based on restoring entire VMs. A ransomware attack doesn’t encrypt every file, so customers shouldn’t need to restore every file to recover. Normal day-to-day business functions routinely change data. These changes are coordinated across multiple files, databases, or even VMs. If you restore files that weren’t affected by a ransomware attack, you may lose transactions or even get out of sync with other systems.
A far better approach would be to incorporate a multi-layered approach such as Rubrik’s instant file recovery into a recovery plan that can make it easy to recover only what you need.
Let's discuss how Zaffre can take advantage of this.
The IT team can navigate to Haverford_Site > haverford-webapp-01 > var > www > html > wp-content > plugins folder as explained in the previous Ransomware Investigation lab section.
Select all the rows files on the page by selecting the box in the top row next to Name.
After selecting the files, notice that the Recover button becomes available.
Click on Recover and observe the various options available to recover the files.
For now, exit out of the recovery option. We will perform the recovery in a later section.
With Rubrik, multiple options for instant file recovery are available at your fingertips!
When an organization is hunting for a threat, the approach involves multiple threads, starting from:
A Security Information & Event Management (SIEM) platform to analyze the log data.
A Security Orchestration, Automation & Response (SOAR) platform to pull together the threat data.
Endpoint Detection & Response (EDR) agents to pull information across the business
File Integrity Monitoring (FIM) to monitor for file tampering.
Intrusion Detection Systems (IDS/IPS) scan for malicious activity.
....There's a lot going on.
What if you could mine the backups of your environment, hunting for the indicators of compromise (IoC) that your adversary has left, like a breadcrumb trail? You could identify the where, when, and what easily. Even better, because you're hunting with the data held in Rubrik, your adversary has no idea that they are being hunted! This is exactly what Rubrik Threat Hunting enables.
You have become aware of a potential breach. The leadership team needs to know where and when the attacker might have gained a foothold. Once this is known, you Rubrik to roll back to a clean point in time.
Note that this page is optional - if you are short on time, please feel free to move on to the next page, where we explore the results of a threat hunt that is already completed.
At this stage, the definitions of the Threat Hunt are pushed down from the Rubrik control plane, down to the CDM cluster. The Rubrik control plane has no access to the data in the backups, and so the scan is executed on the appliance on-premises (or in the cloud, if using Cloud Cluster).
You can monitor the progress of the threat hunt in the Events tab in Data Protection.
From the app-tray in the top-right of the interface, launch Data Protection
Click on the Events tab and then to Events Logs
In the filter field, Select "Rubrik-Demo1" (A) from the Clusters section and select Threat Hunt (B) from the Event Type section.
It may take a minute or two for the hunt details (C) to appear, as they are first composed on Rubrik, then pushed down to the cluster for execution
After a few minutes (dependent on the parameters that you specified for the hunt), you should see the hunt move to Completed status. You can then move back to the Threat Hunt interface to explore the findings of the hunt.
Rubrik Threat Hunting provides the ability to scan across points in time. Not only can you scan multiple points in time for a single server, but you can also scan across your entire environment. This allows you to determine exactly when and where an Indicator of Compromise was first seen.
While every attack is unique, the MITRE Cyber Attack Lifecycle shown above maps the overall pattern. As you can see, there's a period of time between the point that the bad actor gains runtime in the environment (the Exploit) and the point of Execution (when the payload is activated: for example, when files start to be encrypted in a ransomware attack). When recovering from an attack, it is vital that you not also recover the initially exploited state, leaving the door open for the adversary to execute their payload again.
Once you know the Indicators of Compromise, Rubrik Threat Monitoring & Hunting can search through time and space to identify your clean recovery point. In this way, you can surgically recover with confidence.
As your time is precious, we're not going to make you wait for the hunt to complete, and you should see an already completed hunt based on similar criteria in your dashboard. Click into this.
How many IoCs are returned? Where have the IoCs been found in your environment? Can you see what parameters were used for this threat hunt?
Armed with this information, the Zaffre security team can formulate a plan to recover from such an attack now and regularly test their preparedness for any future attacks. How would you use this in your environment?
Time to build a threat hunt, so you can find the entry point of the adversary!
If you haven't already connected to the Rubrik Security Cloud, head back to the lab environment.
Once logged in
Click the app tray in the top right
Launch Data Threat Analytics app
Click the Threat Hunts tab
From this window, we can start to build out our threat hunt.
Click Start Threat Hunt to launch the wizard. From here, you define the criteria for your hunt. You can specify a fully-fledged YARA rule, or you can specify a file hash (such as md5, sha256) or file pattern (such as a path or paths or a specific file extension).
Select YARA Rule
Click Next.
You now specify a YARA rule. The rule provided by the Zaffre team is sourced from the open-source infosec community and can be seen below.
Use the copy button to copy the entire YARA rule and paste it into RSC.
This YARA rule searches for a string based on a regular expression (which Rubrik stores as $eicar_regex), identifying the commonly used EICAR virus test file.
Note that for the purposes of this lab, the hunt is for a benign target and demonstrates the capabilities of this feature without unleashing malware into the lab. In the real world, you're probably searching for something malicious!
Once pasted the above rule into the field, click Next
Select the Rubrik-Demo1 cluster by checking the radio button
Click Next to continue
Check the box to select all objects protected by the cluster, then click Next.
Give your search a name, then select a timeframe for the search - either the most recent snapshot, or specify start and end dates to scan a time range. If you opt for the latter, you can also limit the number of snapshots scanned per object to complete the hunt in a shorter timeframe. For this lab, you may opt for either option on this screen. Click Next.
On the next screen, you can apply filters to be more specific with your hunt. The more specific you can be, the quicker the hunt will complete. You can leave these as defaults in this lab.
Click Next.
You can add file exclusions, file size, etc., on this page. For now, leave them as default. Click Next.
Review your Threat Hunt parameters, then click Start to begin the hunt.
The Legal and Compliance department wants to understand if the attackers have exfiltrated or had access to any customer information such as PII or PCI data, containing credit card info. They want to understand if you can help them identify if attackers have access to any sensitive data.
You have access to the Rubrik Enterprise edition, so let's start with Sensitive Data Monitoring to see how you can help the Legal team.
By accessing the Anomaly Detection app, you have already established the timeline for the cyber attack. You are already aware that the attackers have encrypted files for Haverford. The legal team would like to know what kind of sensitive information the attackers have access to and encrypted.
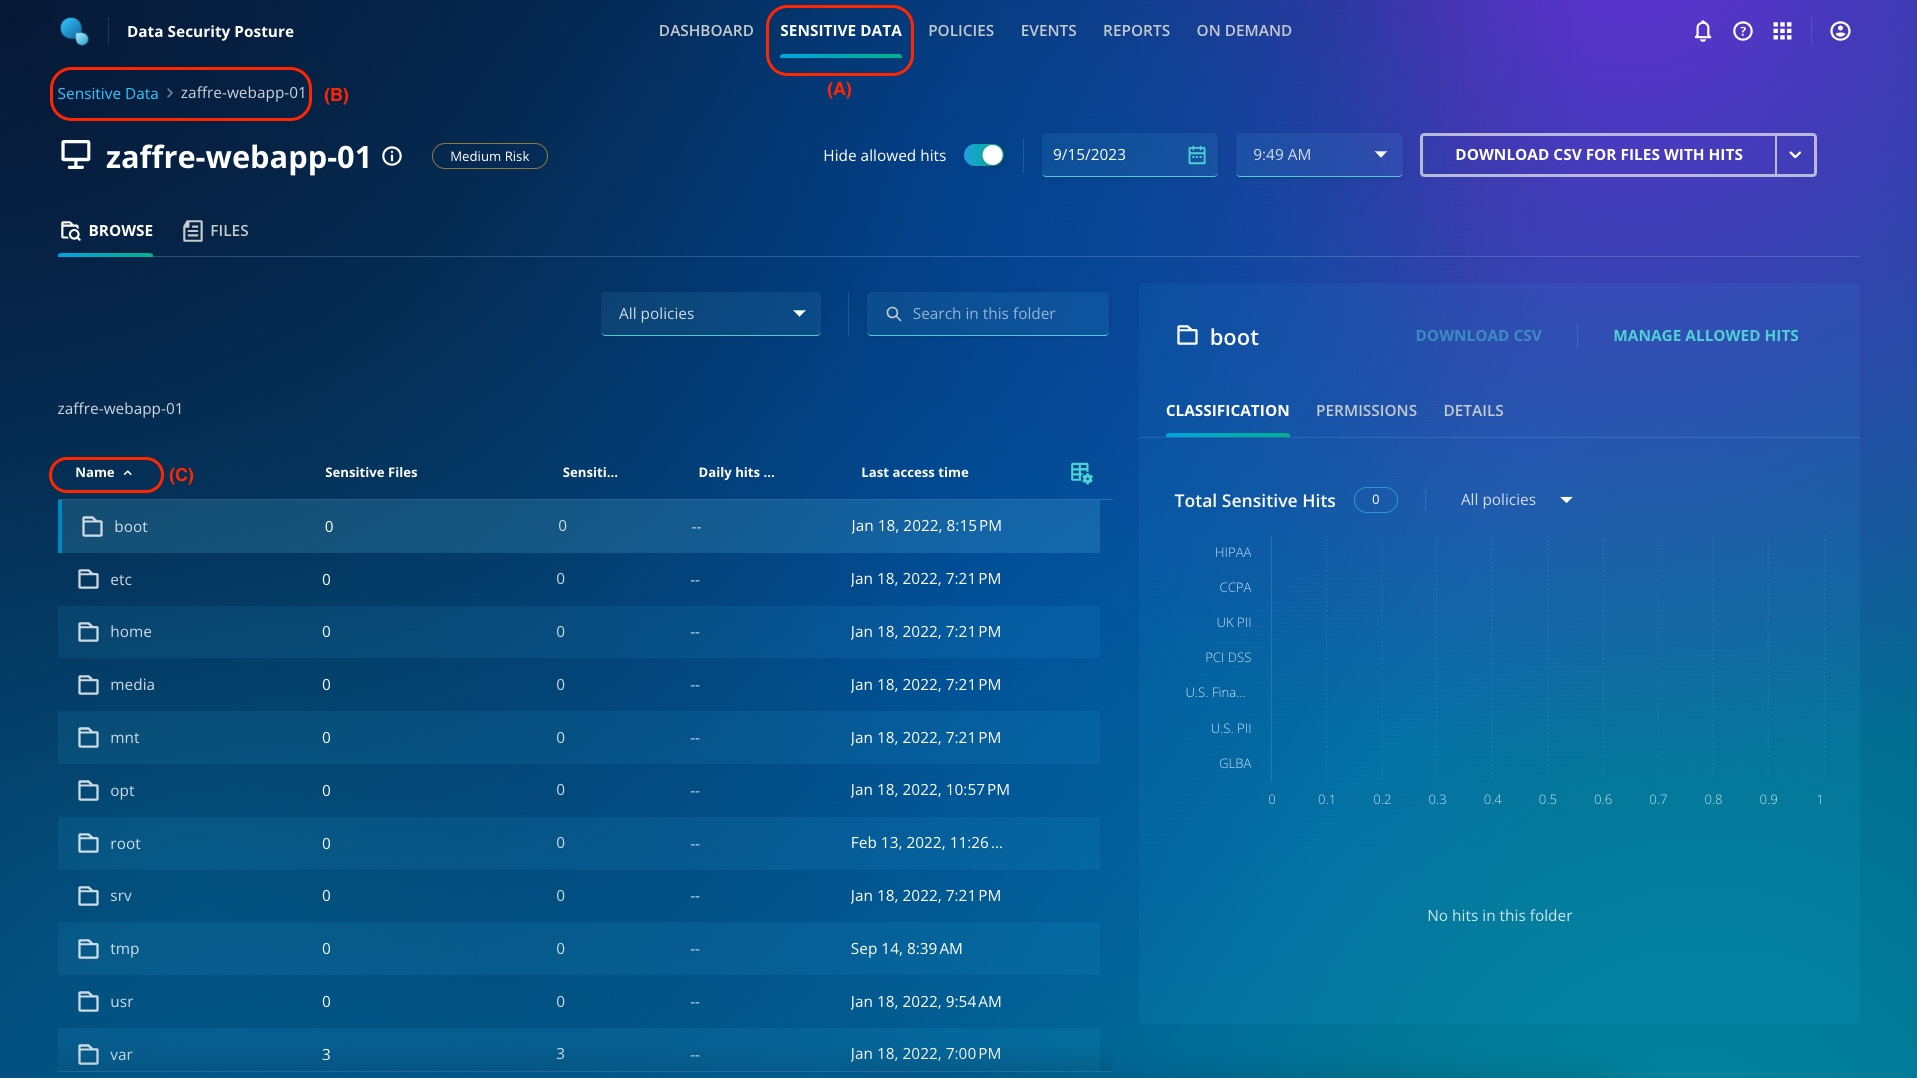
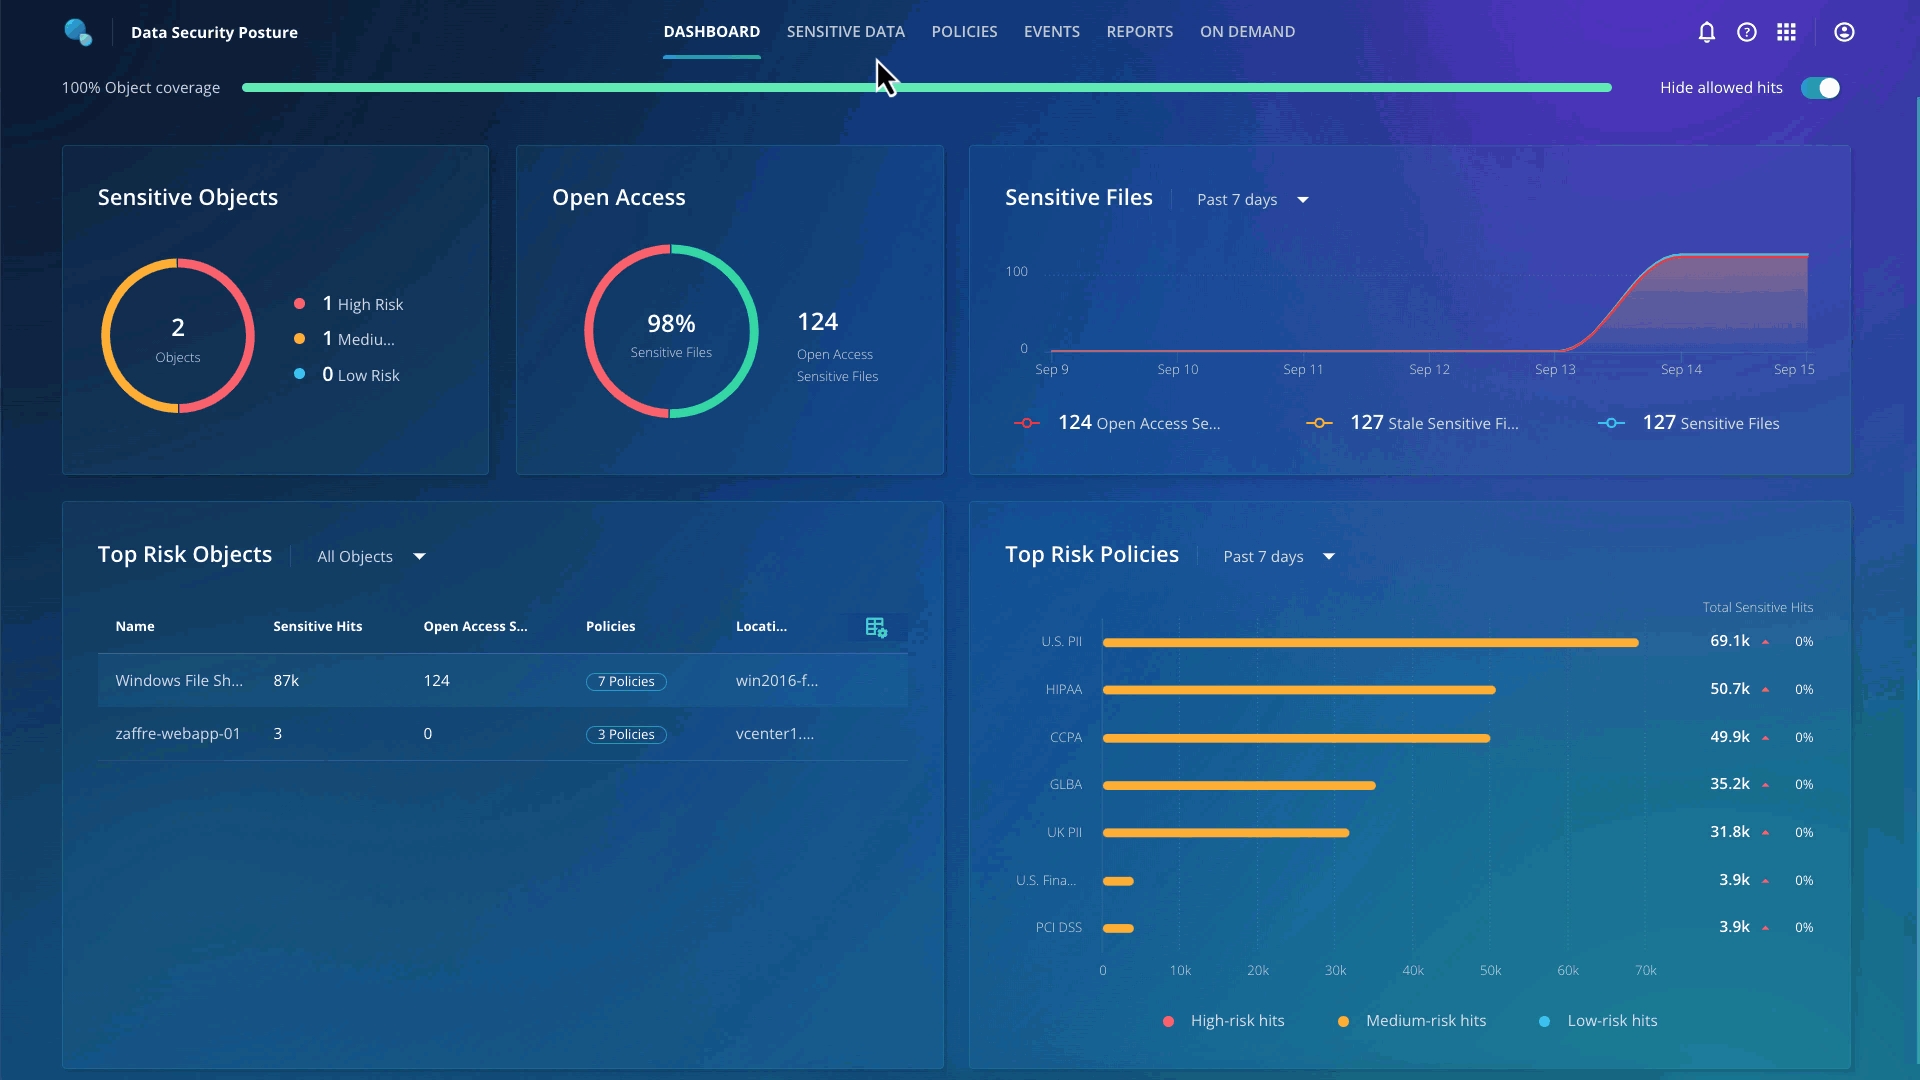
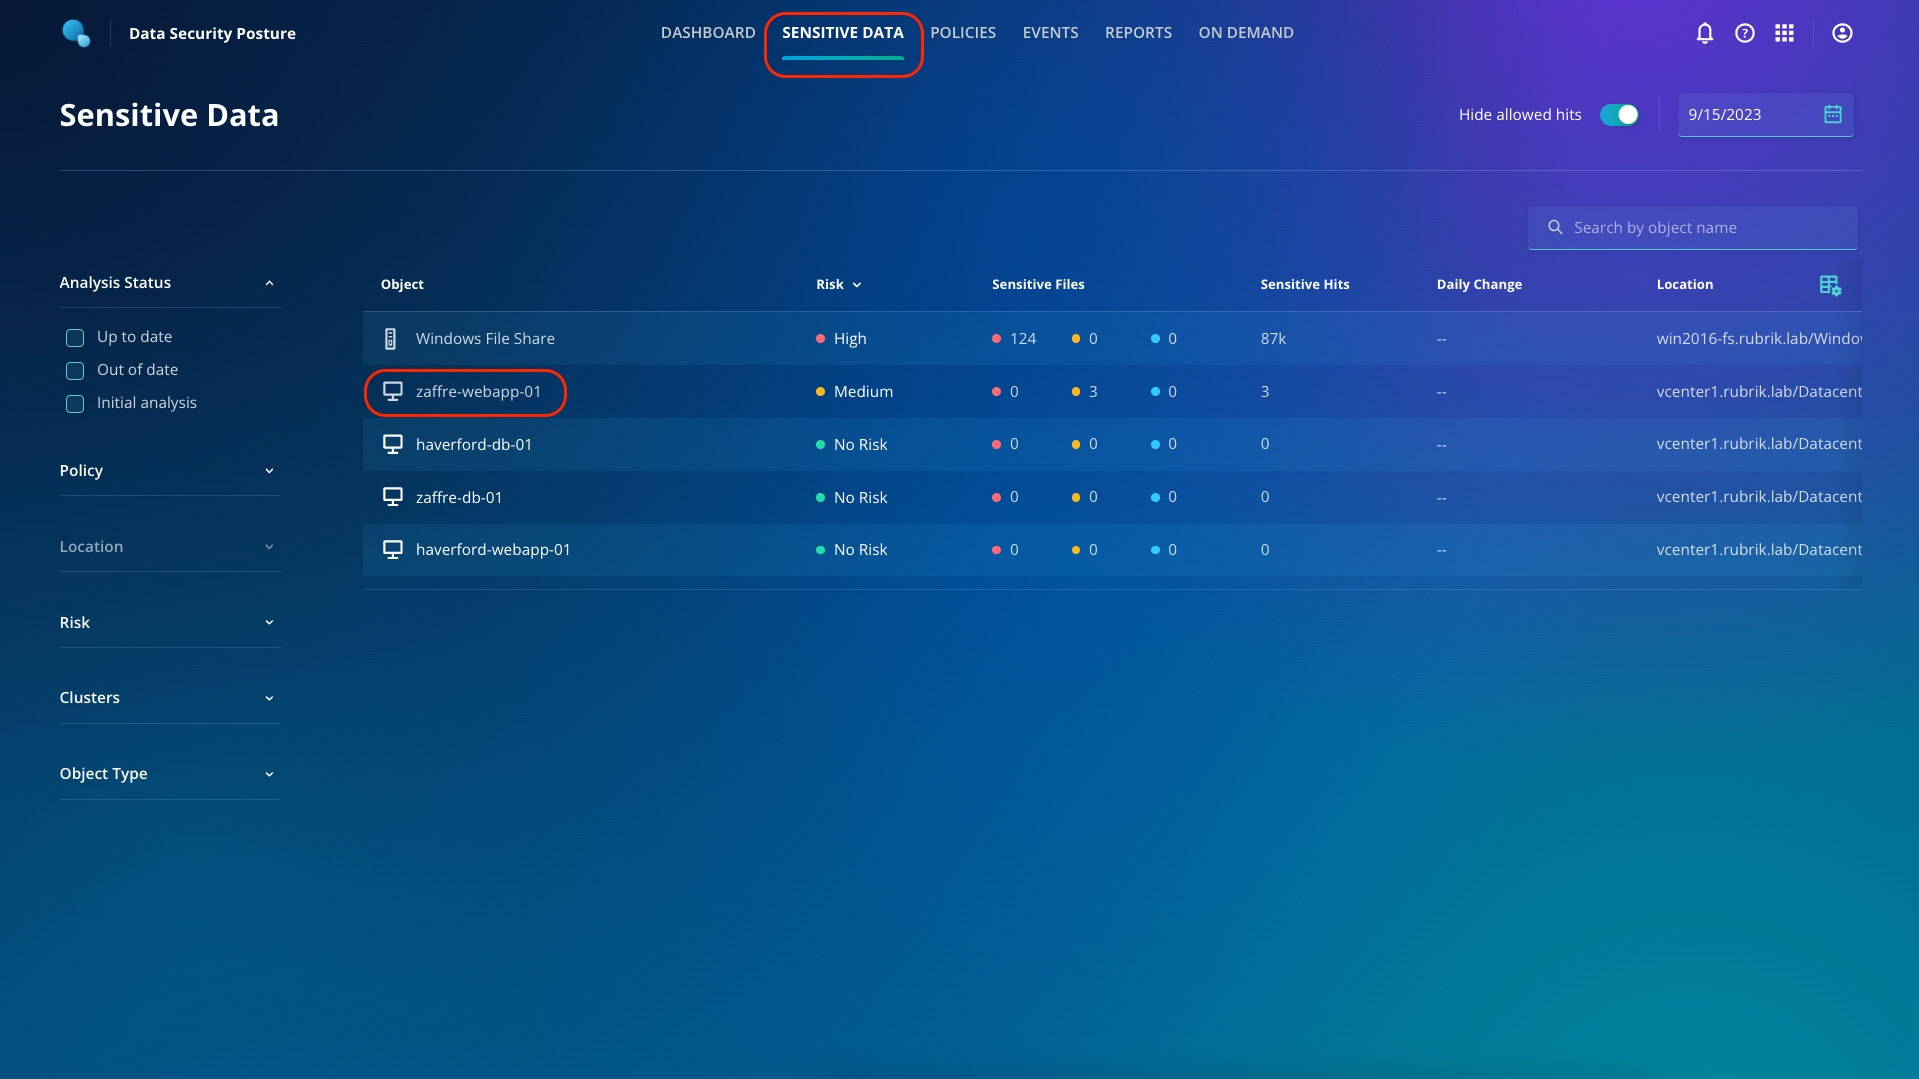
To get started, navigate to Sensitive Data from the top ribbon (A).
Click haverford-webapp-01 (B).
Click Sensitive hits to change the order from ascending to descending (C).
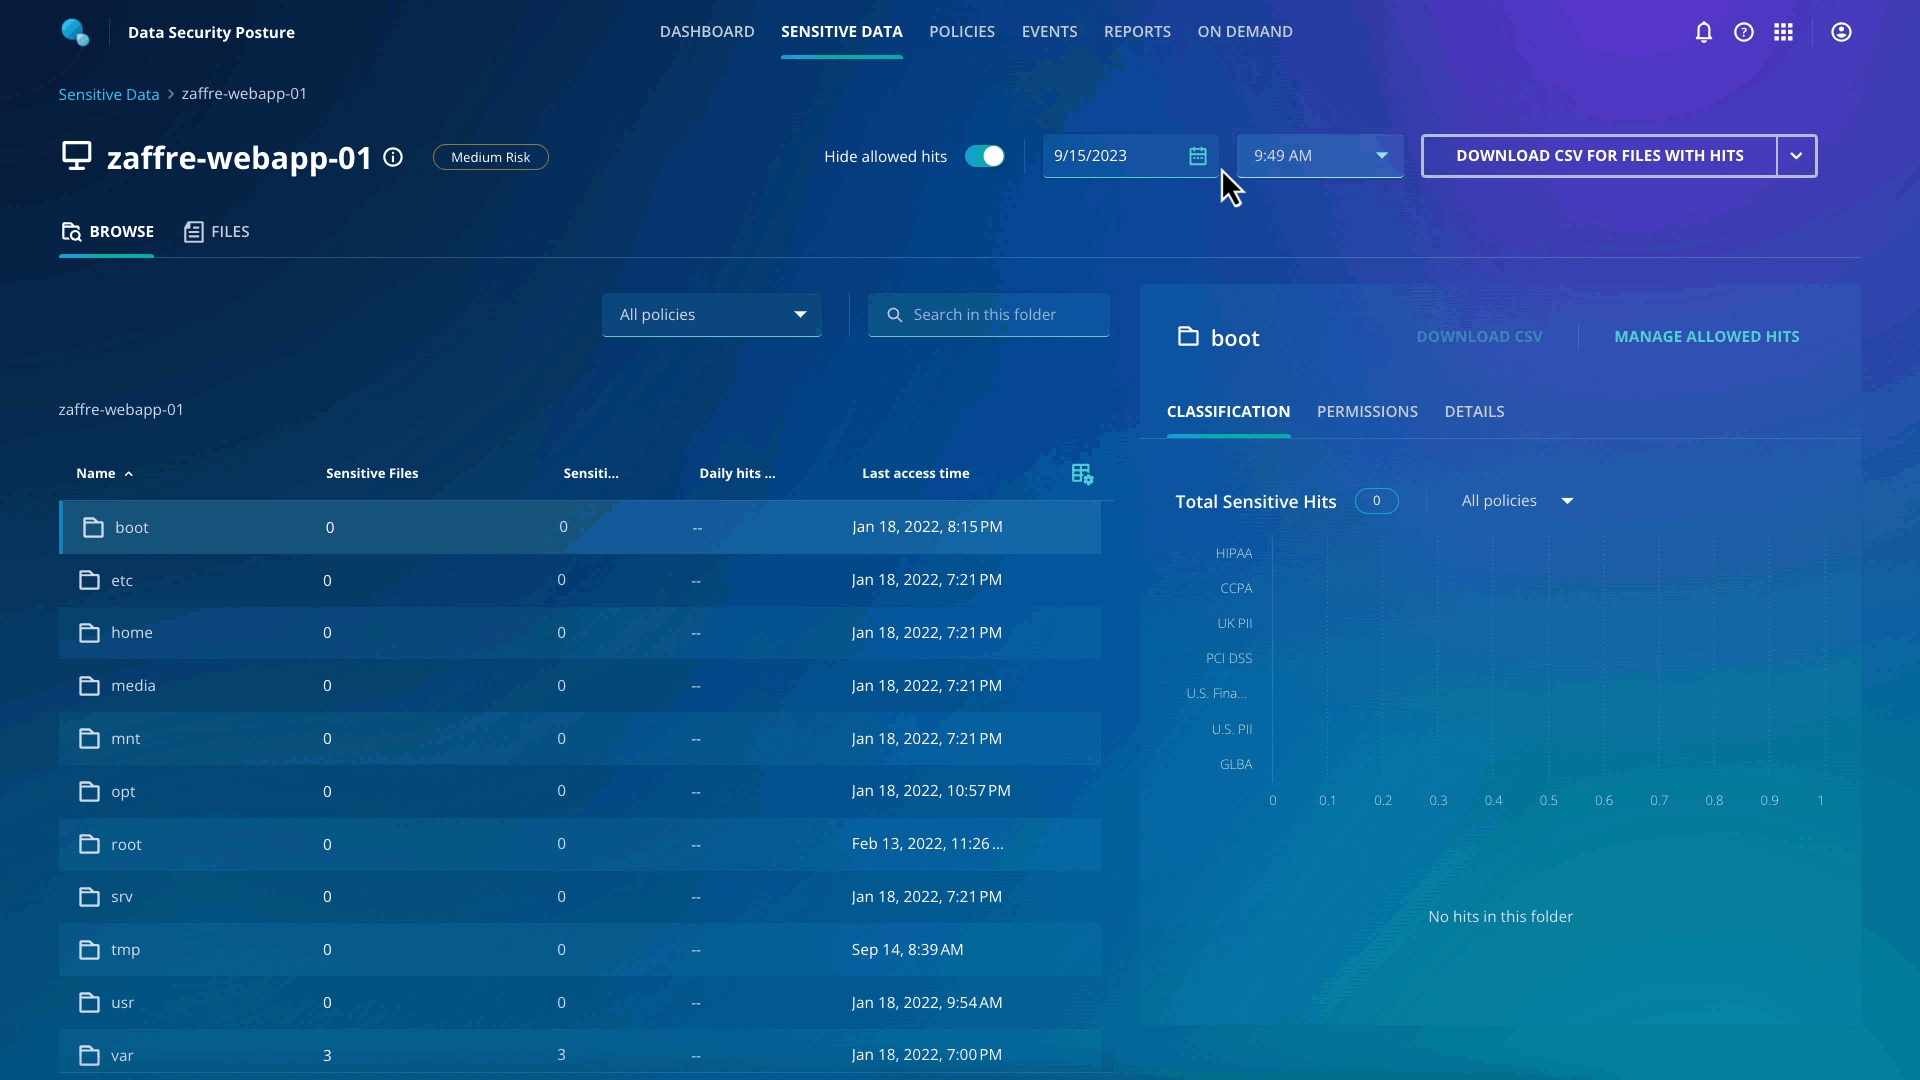
You will observe that there are 0 sensitive files at this moment.
Now, let's change the snapshot to before the attack. From the dropdown menu for time, select the 1st snapshot (be sure to select the first day and first time for the snapshot).
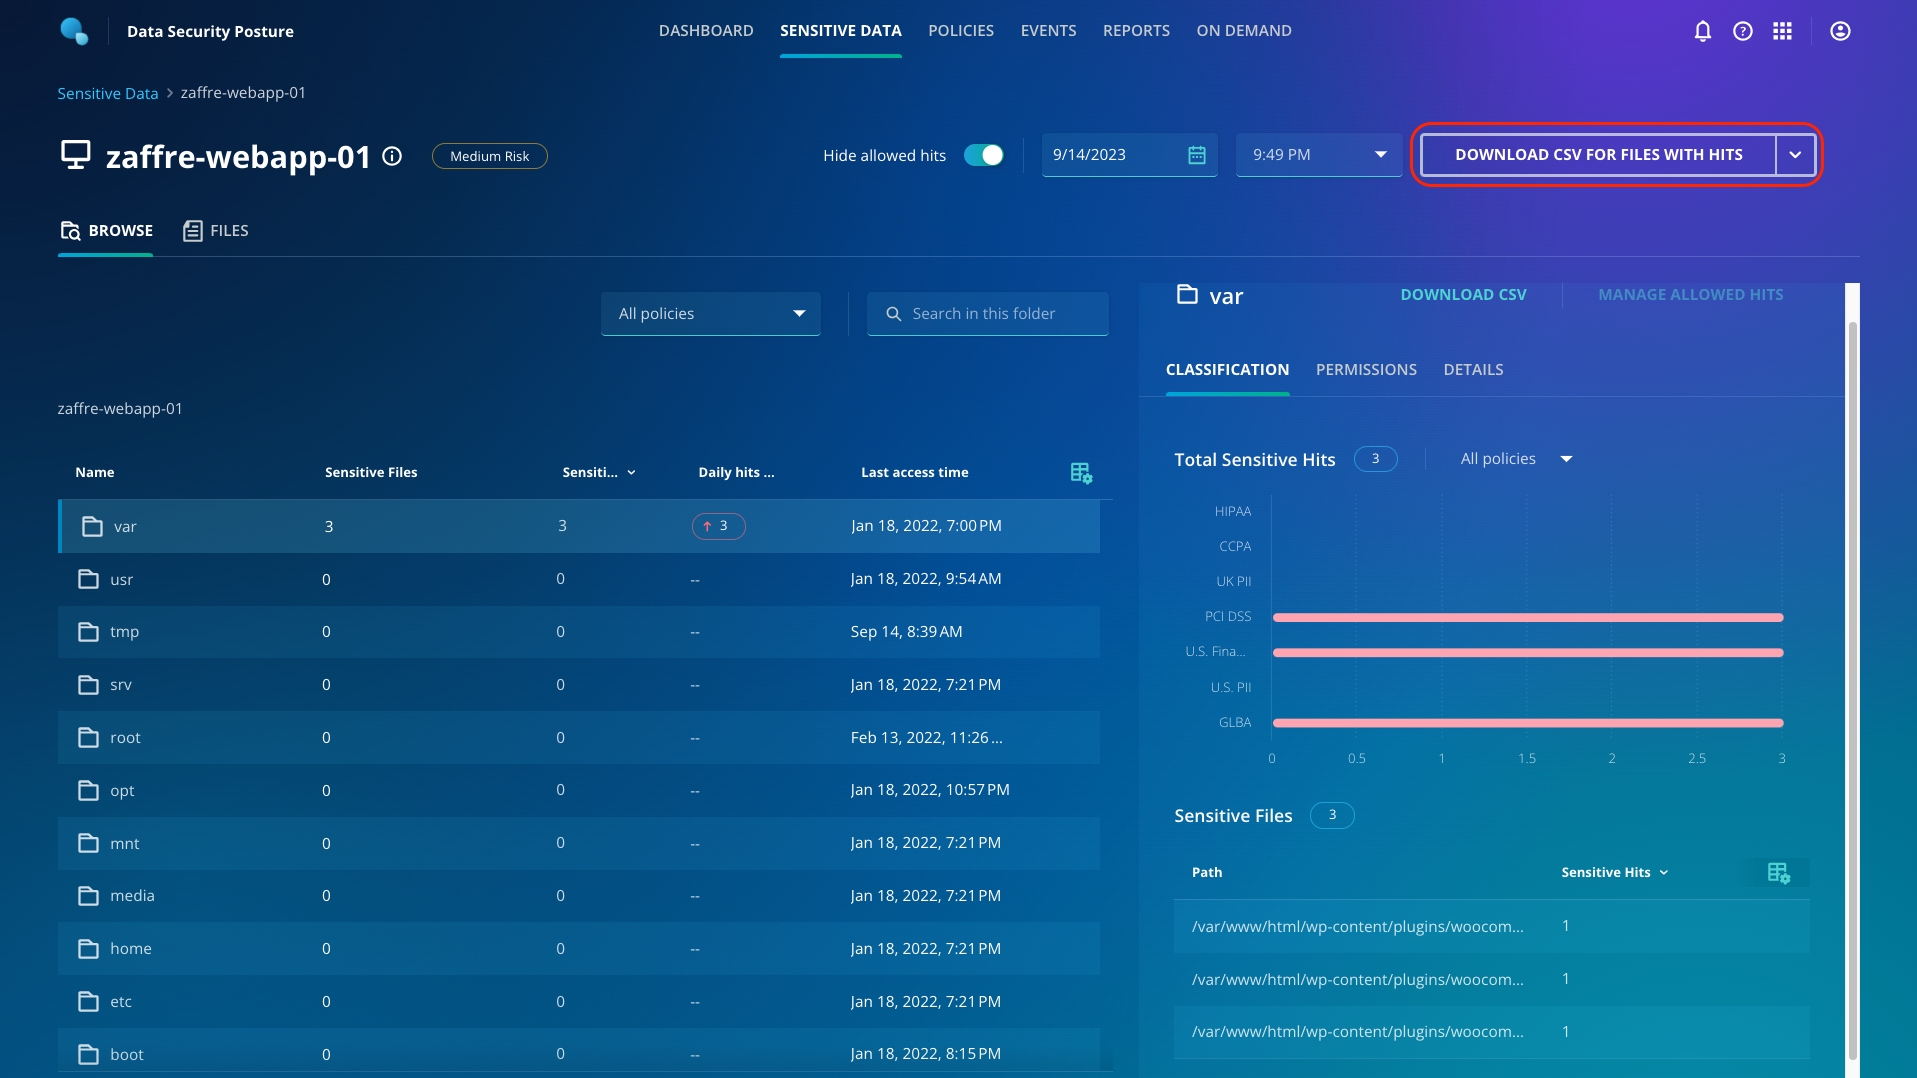
You can see that there were sensitive files present in the var folder, which the attackers now encrypted!
You can download the list of files with hits by using the Download CSV For Files With Hits button on the top right.
Now you have provided the legal and compliance team with the ammunition to get to the bottom of the data access issues.
With Sensitive Data Monitoring, there is no additional lift to get access information.
There is no impact on production data or the performance of the system.
The same app can scan 10-100's objects that are protected by Rubrik.
I bet that's not the first ransom note you have seen!
Let's start identifying the threat and blast radius using the Anomaly Detection app!
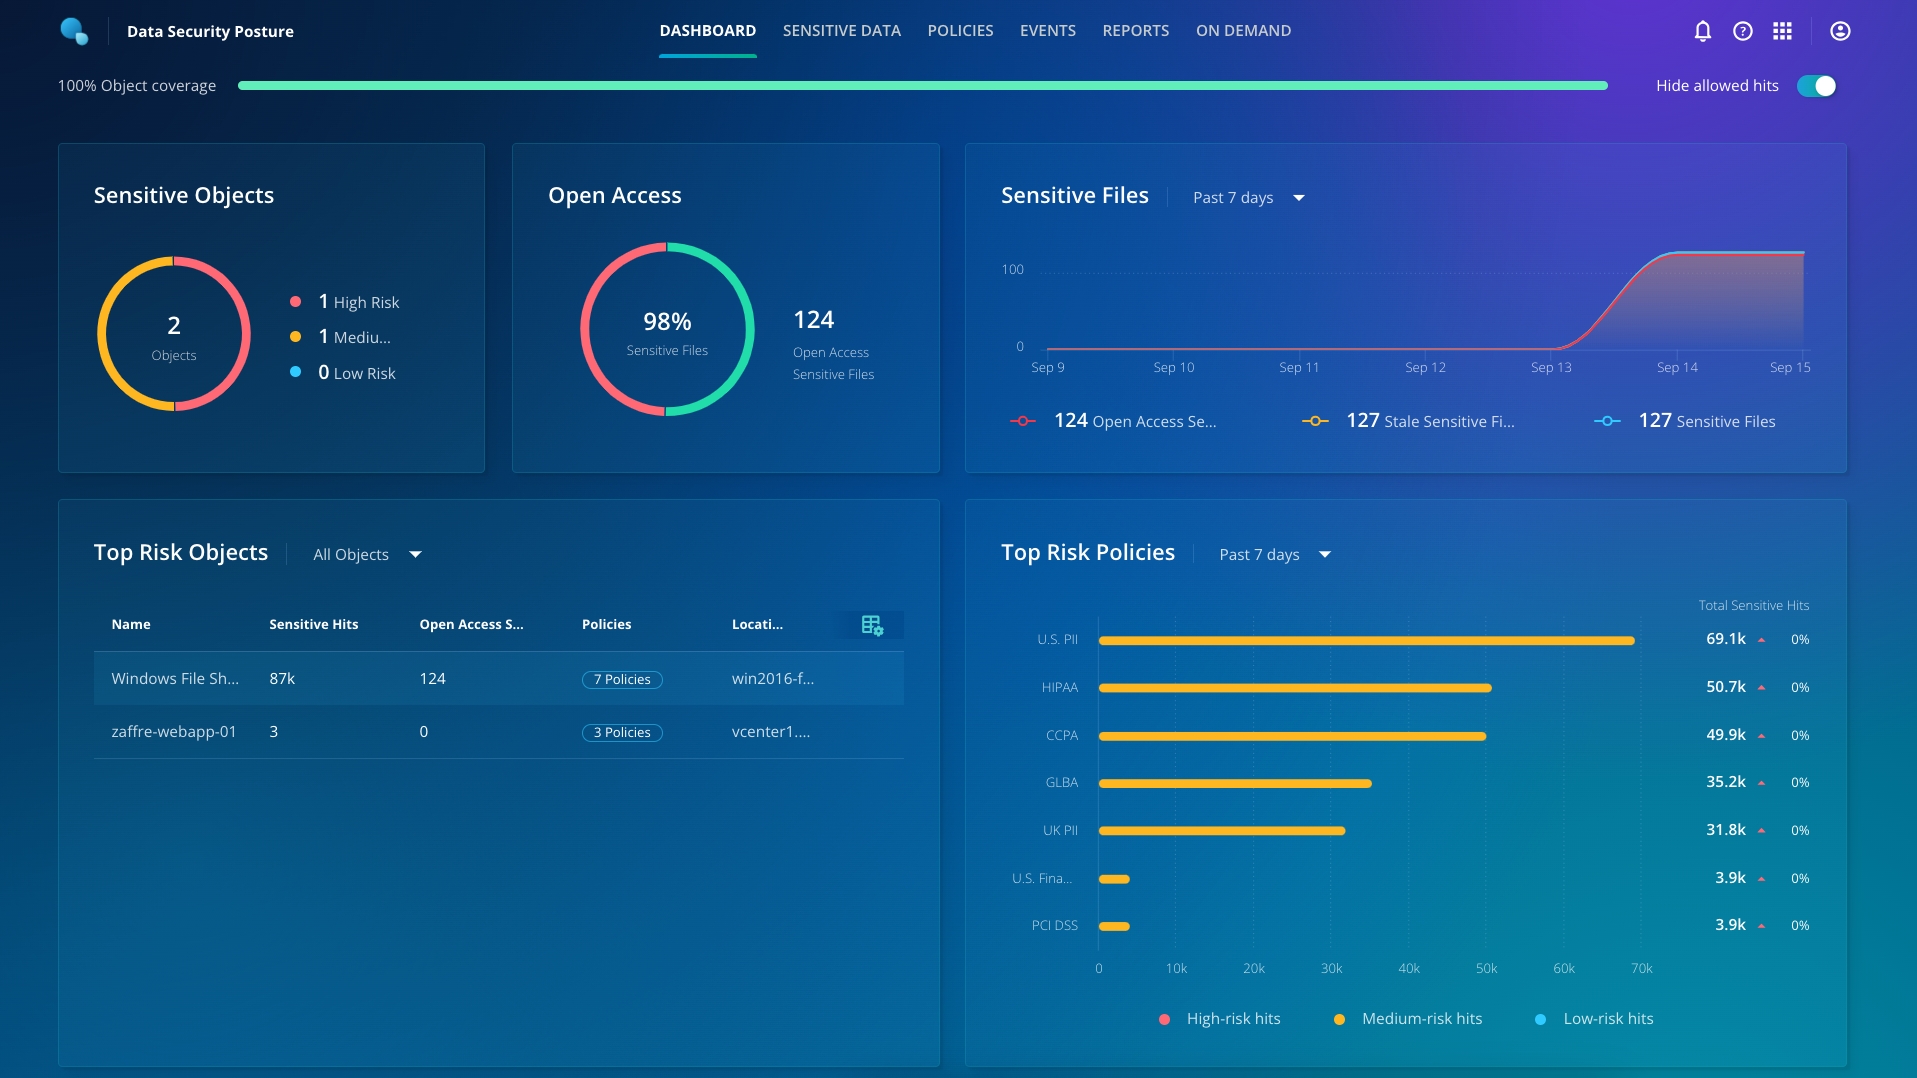
From the Sensitive Data Monitoring dashboard, you can see at a high level what the tool has discovered. On the top row, we can see a summary of all the sensitive files over the past 7 days.
Next, on the top right, the Open Access card displays the summary of files with open access. You can click here to get info on sensitive data stored in files with no access restrictions.
The bottom row with the Top Risk Objects card displays the top hits by policy and the top risk objects to you.
Without any deep introspection, you can now know the scope of access to sensitive data.
As organizations adopt a hybrid model for their infrastructure, they grapple with massive data fragmentation, making it impossible to know where sensitive data resides. At the same time, the increasing risk of data privacy breaches and non-compliance with regulations can impose serious financial penalties. Sensitive Data Monitoring is an application in the Rubrik Security Cloud that discovers, classifies, and reports on sensitive data without any impact on production. By leveraging their existing Rubrik deployments, customers get up and running in just a few minutes with zero additional infrastructure required.
Sensitive Data Monitoring is available in the Rubrik Security Cloud as an application.
If you haven't already connected to the Rubrik Security Cloud, head back to the lab environment.
Once you're logged in, click the app-tray icon in the top right of the user interface, then select Data Security Posture.
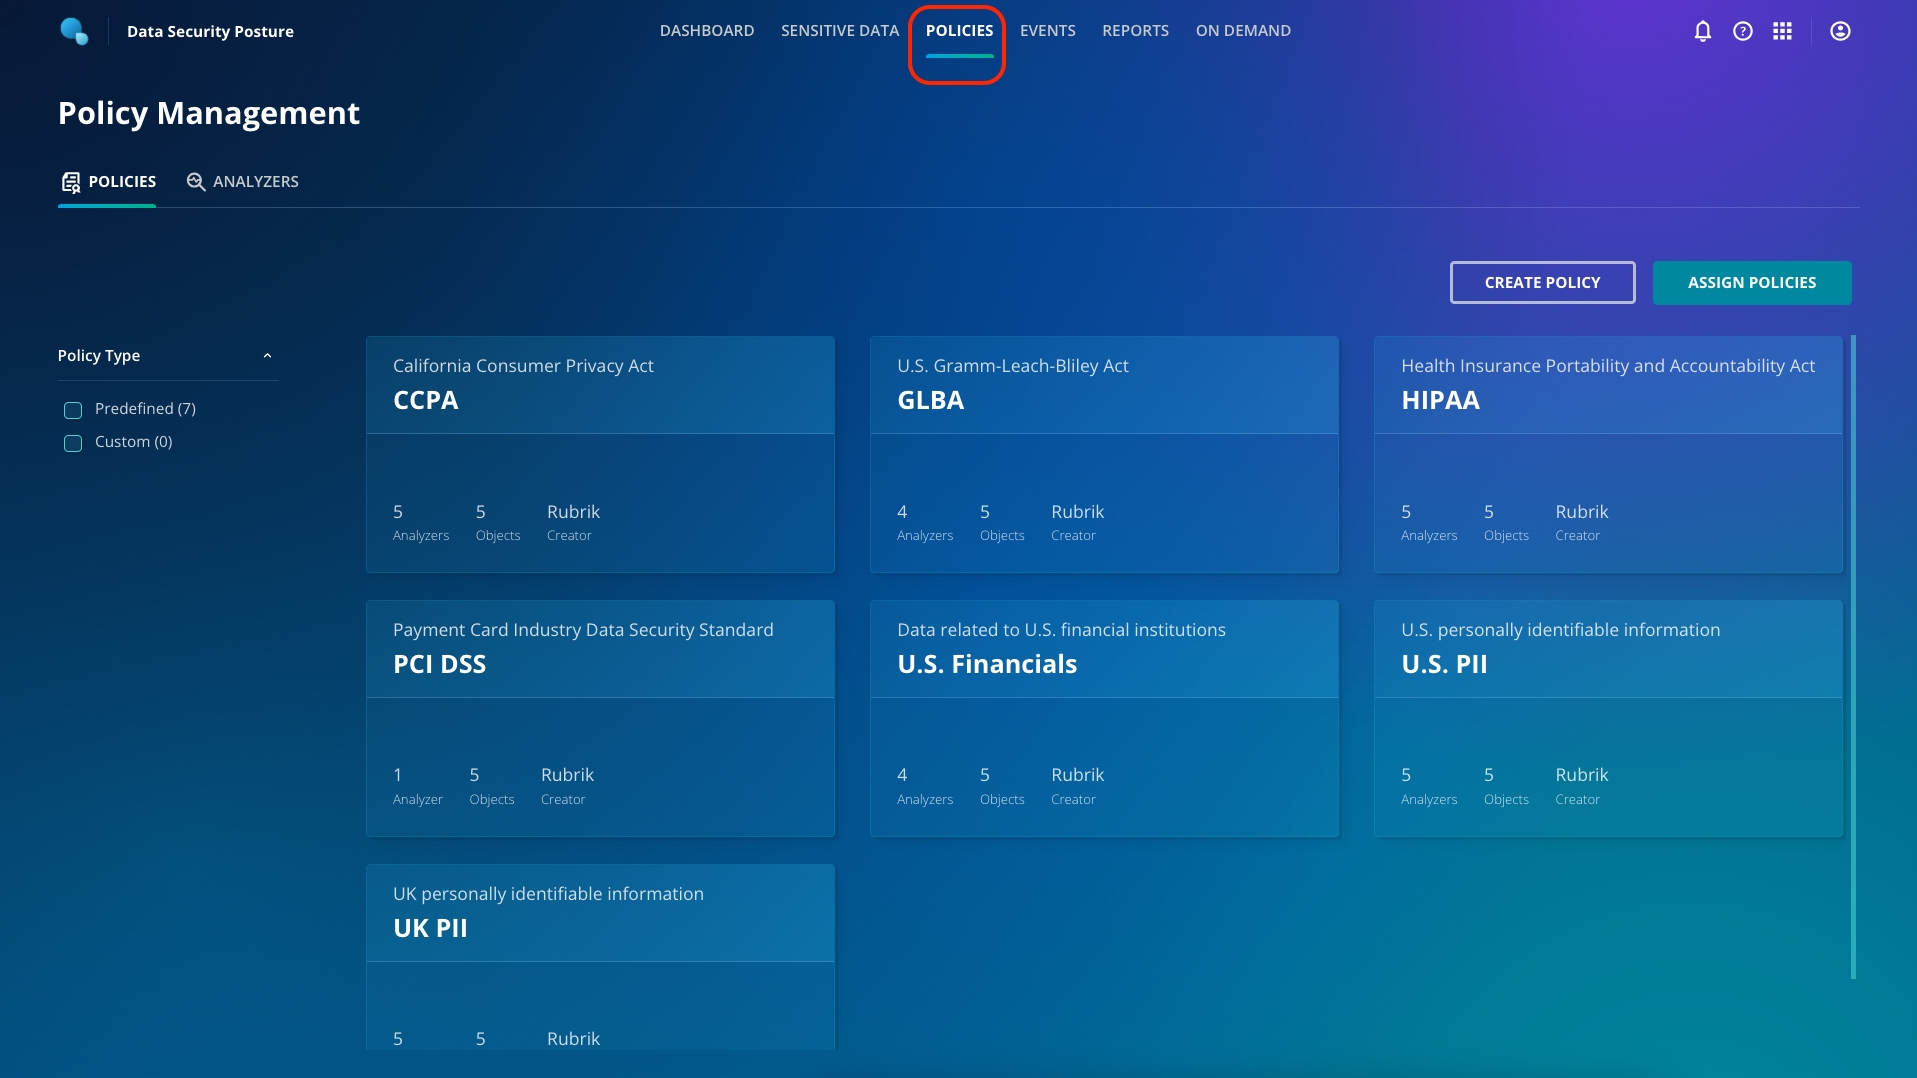
You've now seen that Sensitive Data Monitoring can help identify where sensitive data resides in your environment during war and peace. You may need to keep track of many different types of data, and Rubrik ships with a number of policies available out of the box to search for these. Click on the Policies tab at the top of the dashboard.
Policies define the data types you want to identify, and they're built from one or many Analyzers.
You can click through one of the predefined policies to see which objects are covered by this policy or which Analyzers are used by this policy.
You can click back to the Management tab at the top of the screen to look at the building blocks of policies: Analyzers.
Well, after the cyber incident response, you shouldn't be surprised to receive a call from the Legal and compliance teams during business as usual times. The compliance team never sleeps! With so much data, they always need to ensure that ZFG complies with the required regulatory bodies and that files do not have open access.
Let's look at how you can use the same tool to keep your legal and compliance team happy.
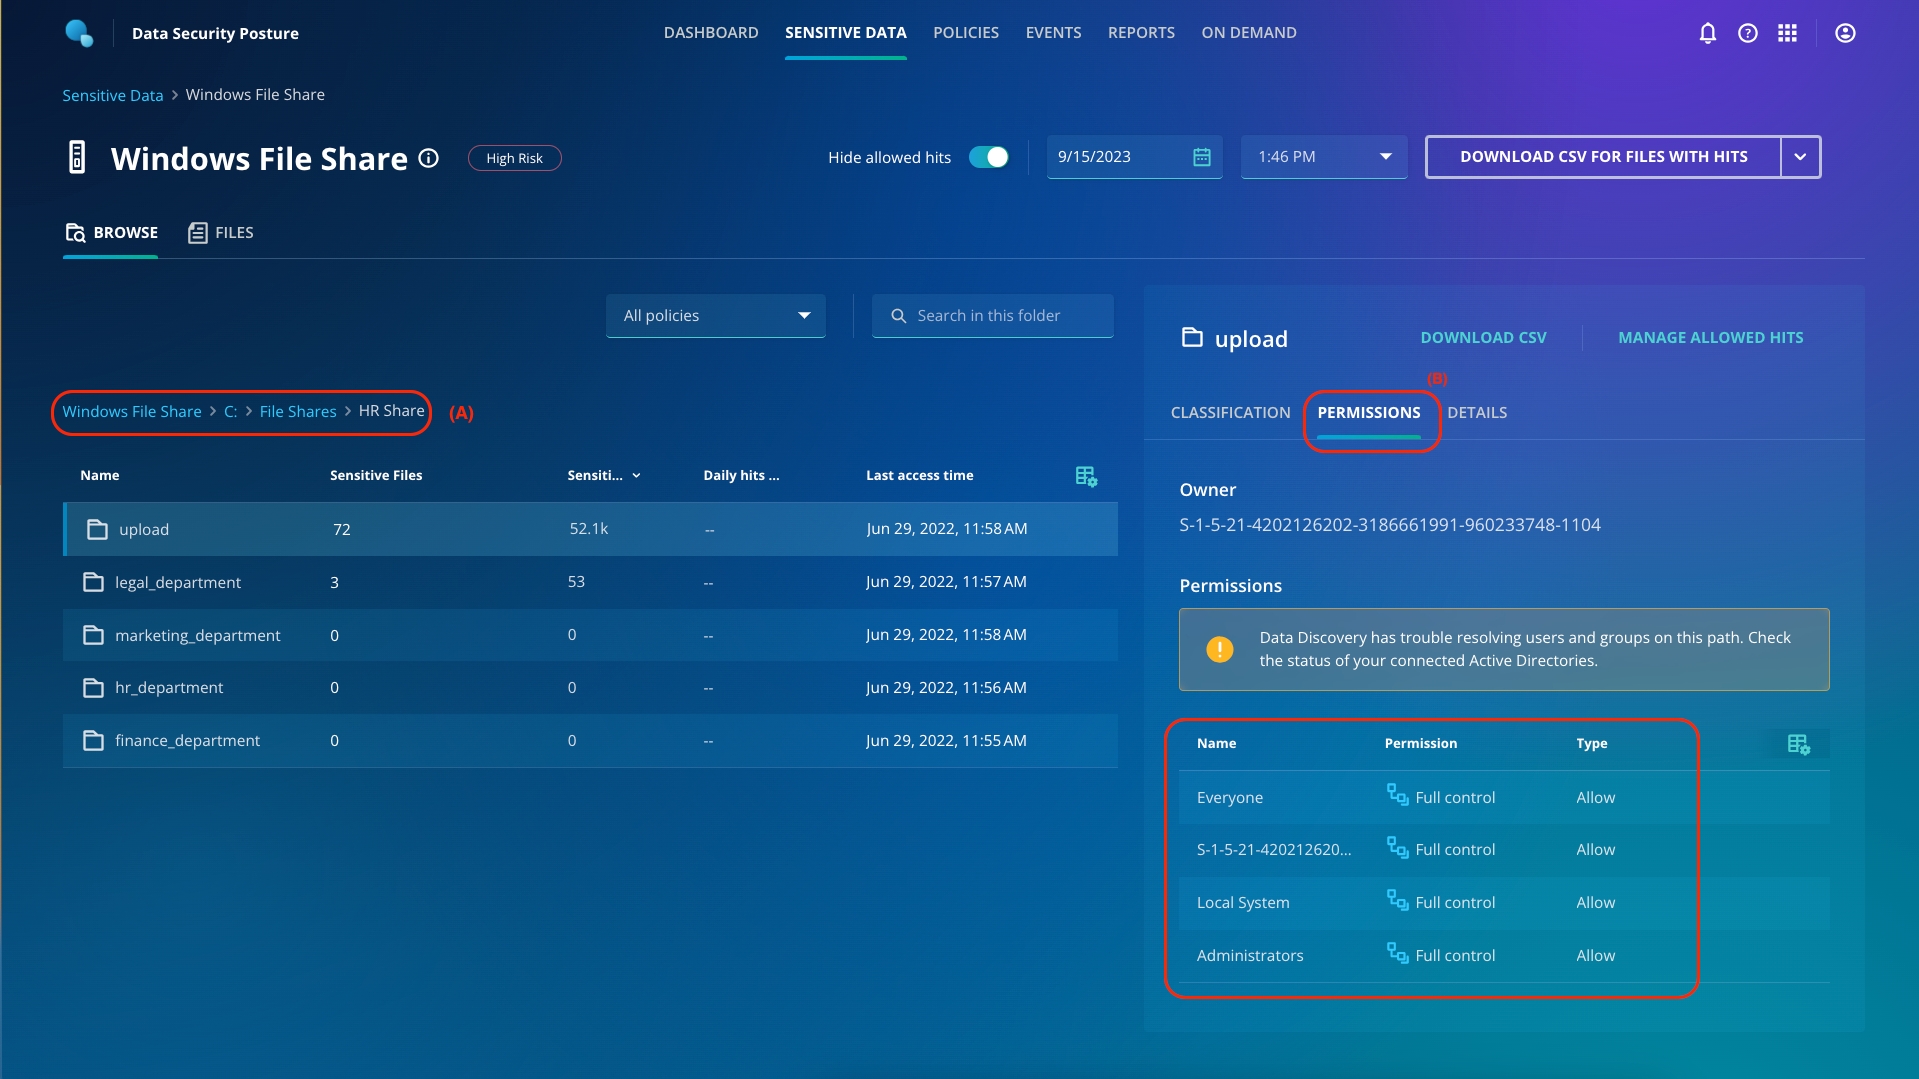
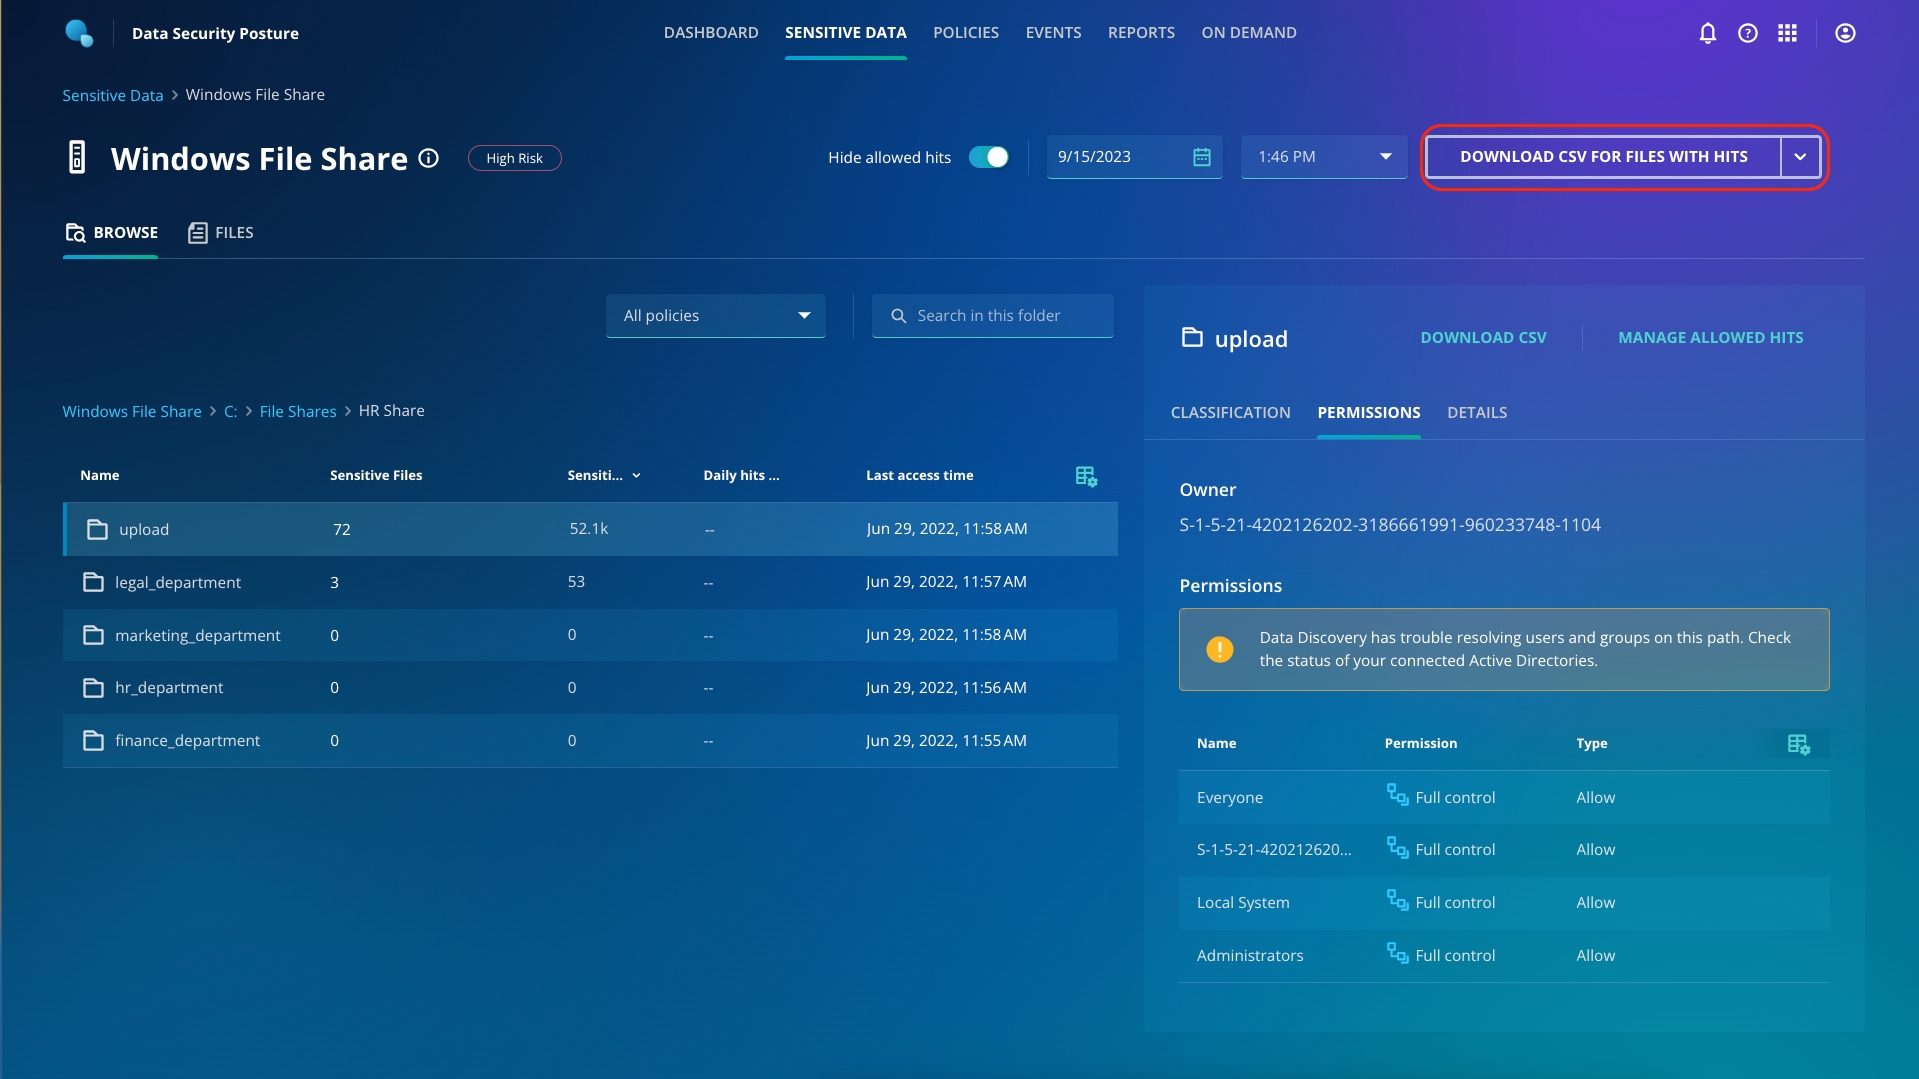
Click Sensitive Data from the top ribbon. Click Windows File Share > C > File Shares.
You must have noticed that Departments, HR Share, and Public share folders have open access and sensitive hits. Click HR Share (A). You can drill down to find the exact affected object and what kind of violations the object has, along with which users have access to the files (B).
From the top right, download the files with hits. You can attach the file which has the list of all the files which have sensitive hits and/or open access.
One thing is for sure HR shares should never be accessible by everyone!
With open access to files, especially sensitive data, you are exposing your data to attackers and failing compliance mandates.
Based on the report, you can select the proper access control and location of sensitive data to protect your ZFG assets!
Sensitive Data Monitoring can be used in war and peace times without additional agents and on the backup data without affecting your production environment!
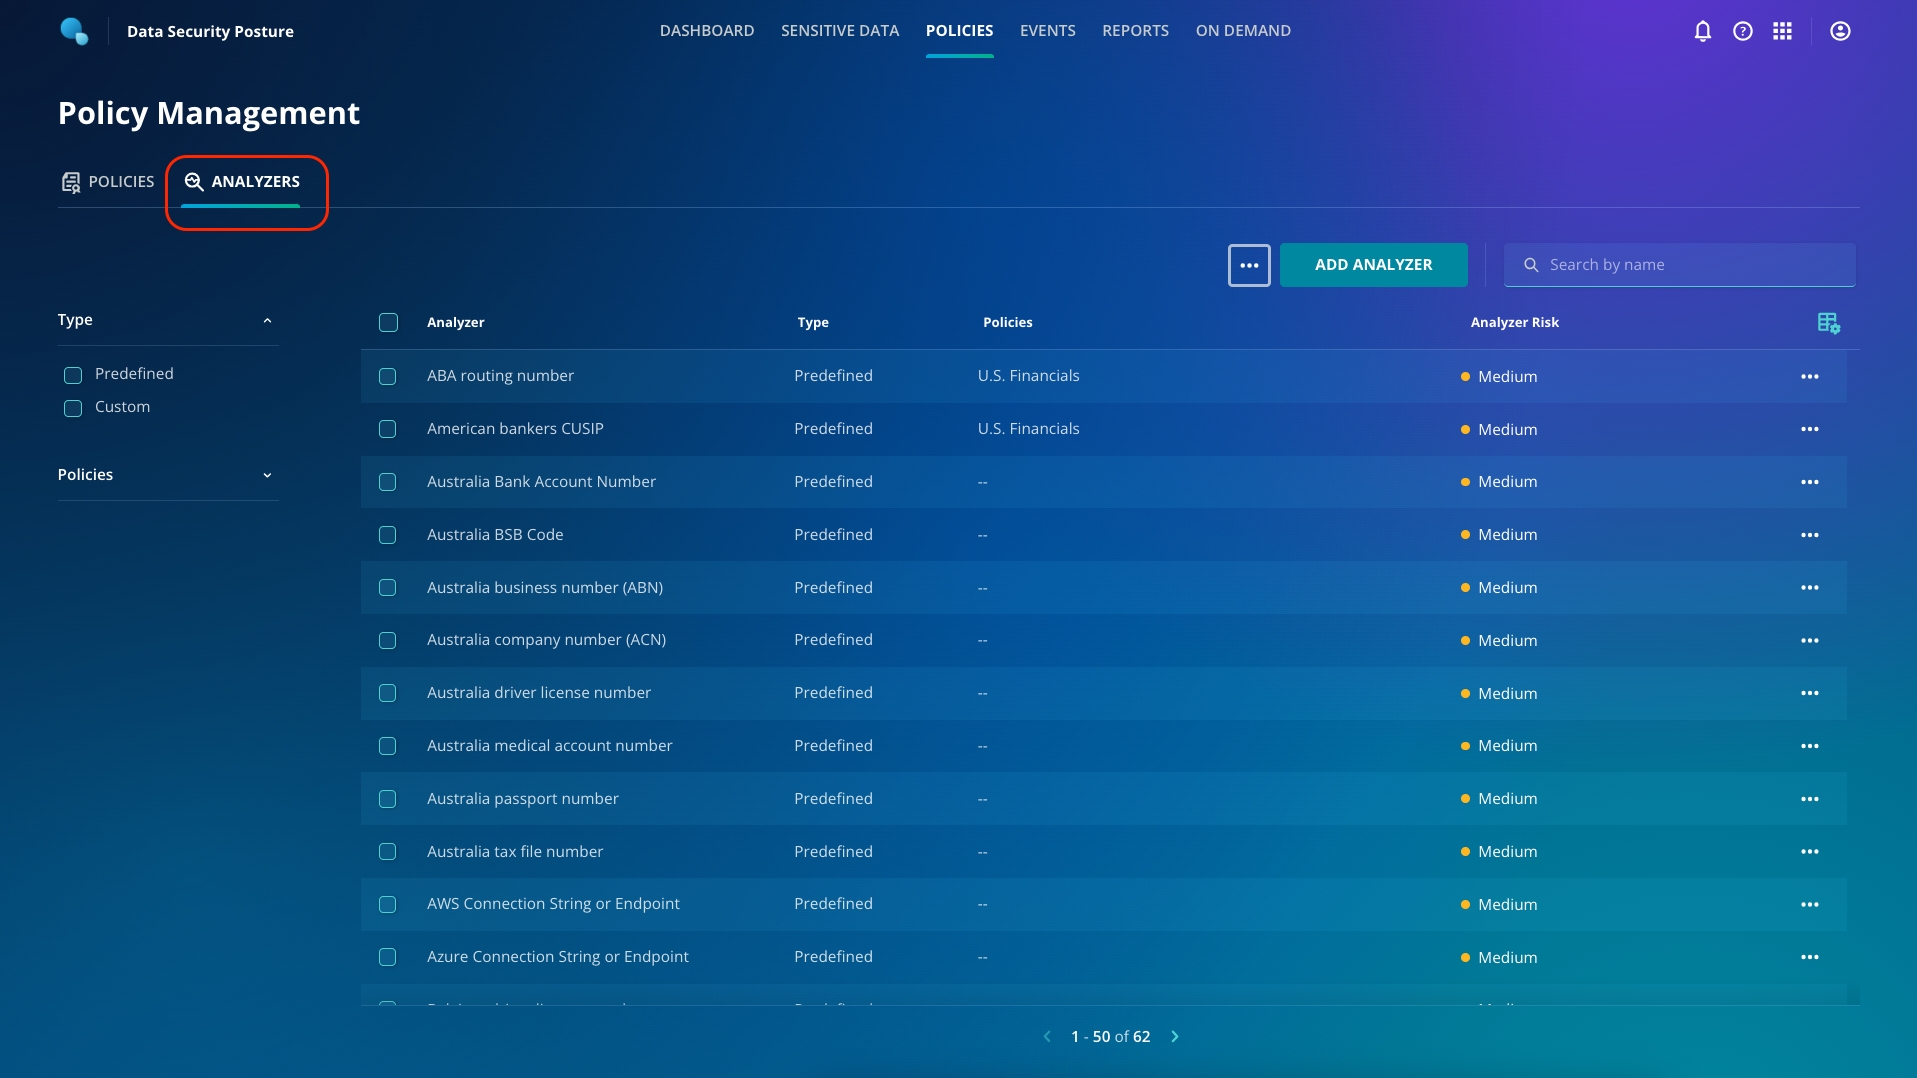
On the left side of your screen, click the Analyzers tab. You can see all of the predefined analyzers that Rubrik includes.
As you can see, there are multiple predefined analyzers, and Rubrik keeps adding new ones quite frequently.
Remember: although Sensitive Data Discovery & Monitoring is a SaaS service that is managed in the cloud, the data scanning occurs on your CDM cluster, so no data ever leaves your control.
Every business is different and has different needs, so Rubrik also provides you with the tooling to build your own Analyzers and Policies. Let's take a look at how that works.
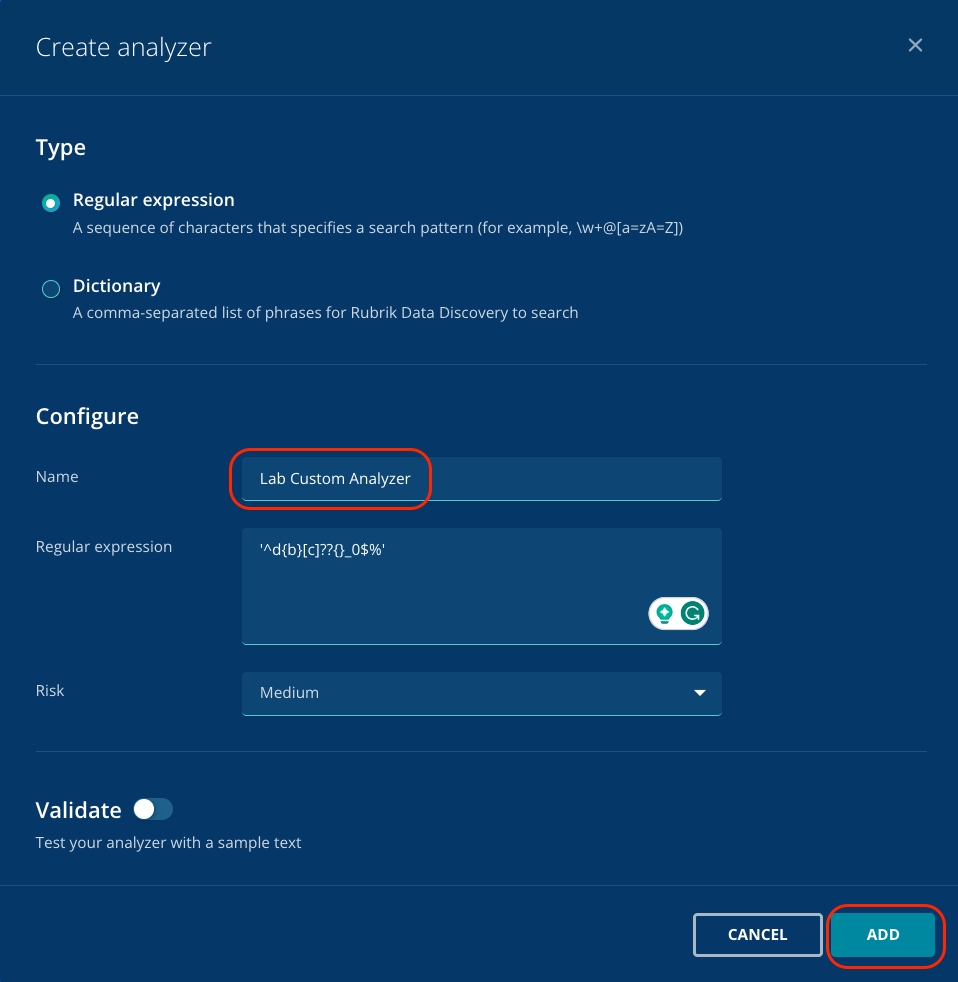
Click Add Analyzer. Select to specify the patterns that you're looking for using either a regular expression or a dictionary; specify what you're looking for (either the regex or set of dictionary words), for example: see below and give your Analyzer a name. Click Add.
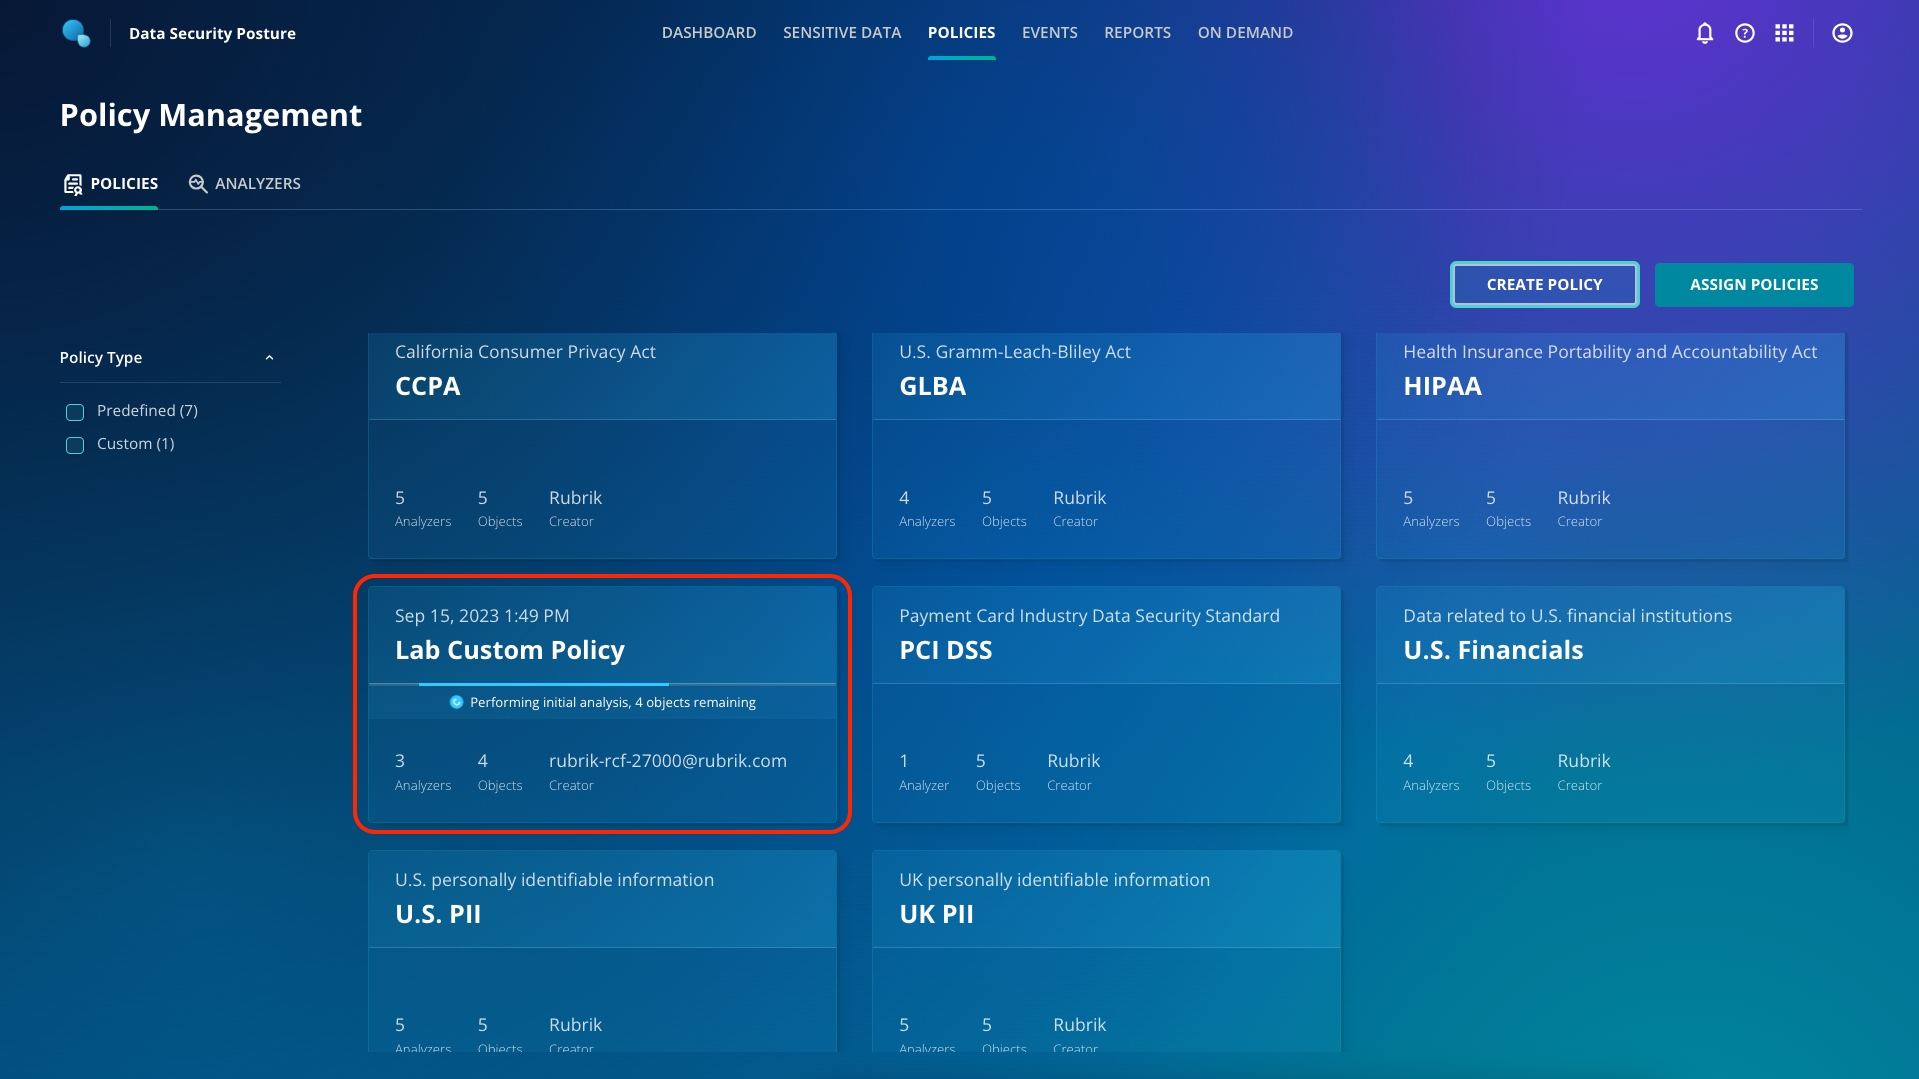
You now see your newly created custom Analyzer in the list for selection, but you'll notice that it's not associated with any policies. Click back to the Policies tab to add a new, custom Policy and tie your custom Analyzer in.
Navigate to Policies. Click Create Policy. Select any number of Predefined analyzers, as well as your Custom analyzer, then click Next.
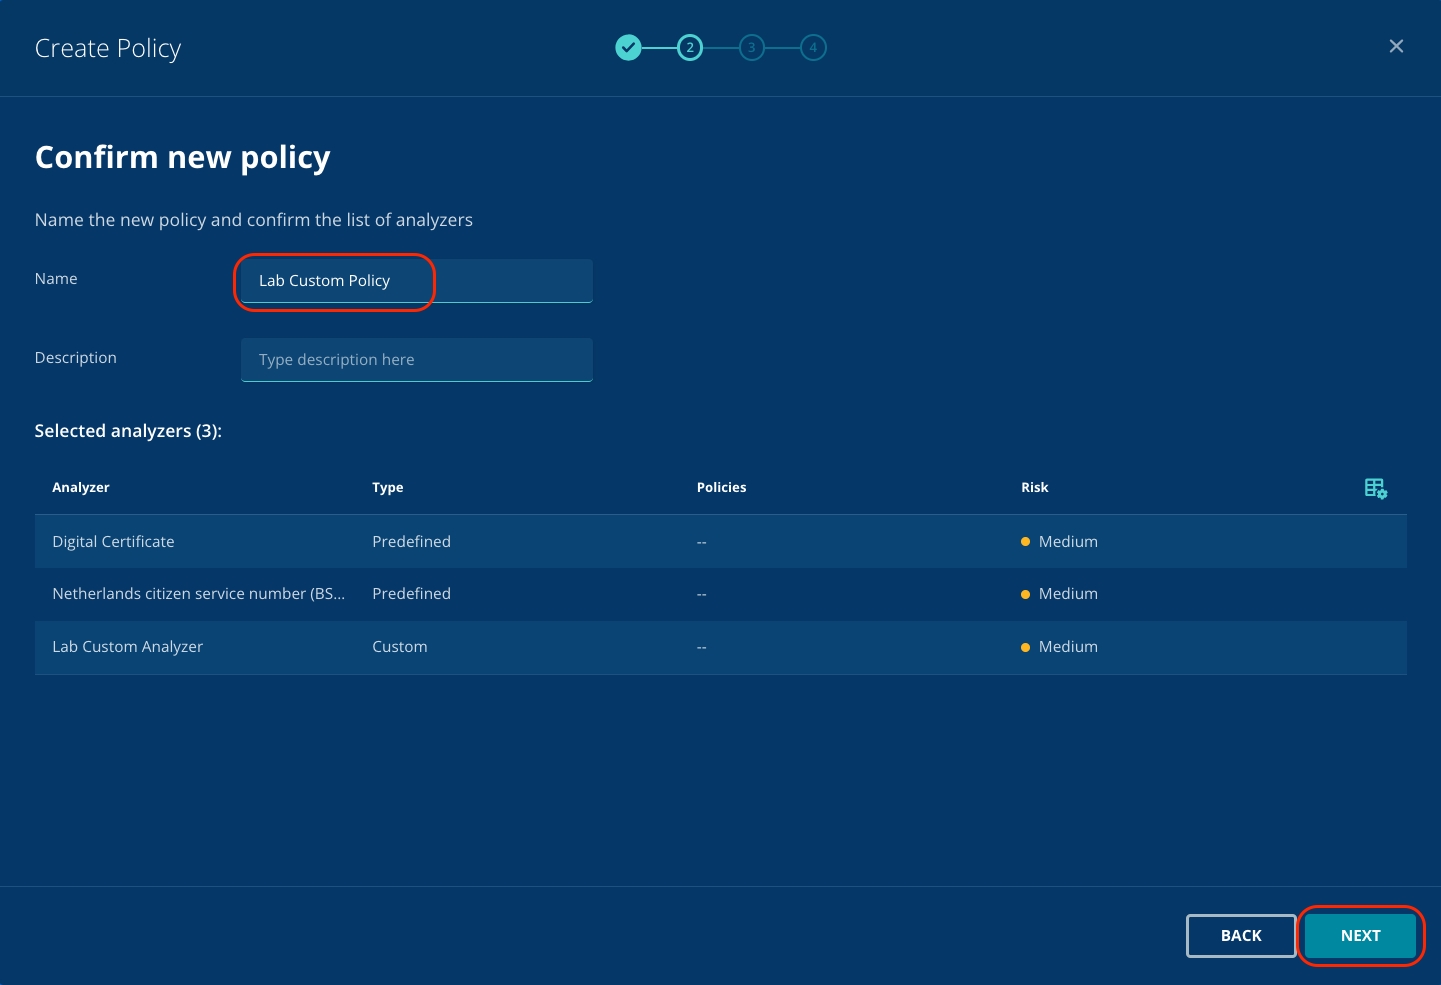
Name your policy, and optionally add a description. Confirm that you're using the Analyzers that you want to use, then click Next.
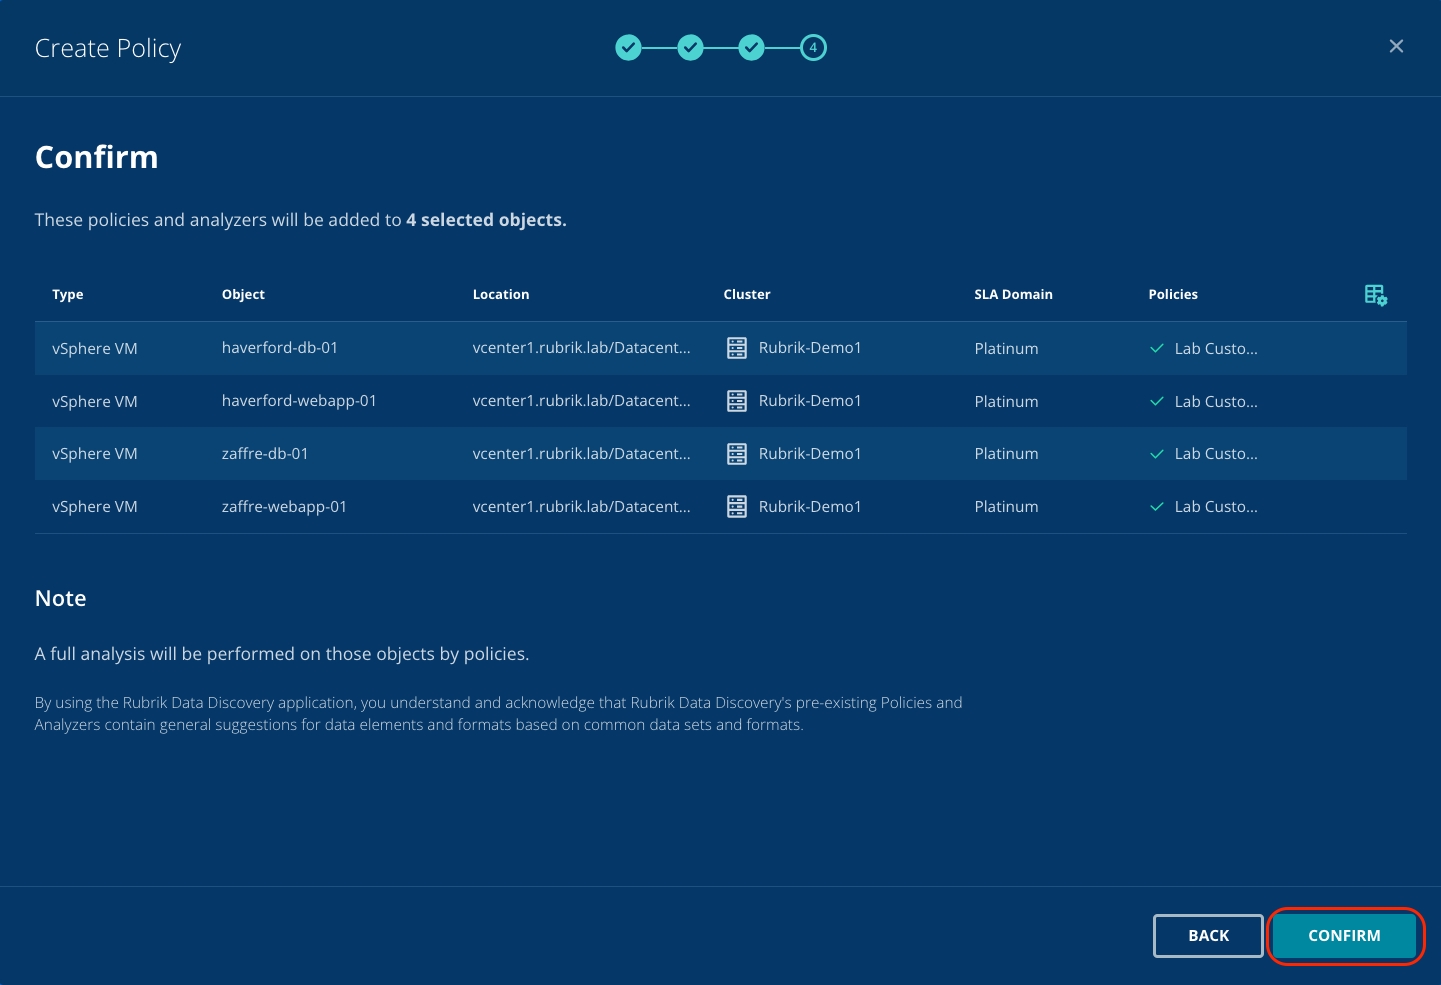
Select the objects that you want to scan with this new policy. In this lab, all objects are vSphere VMs but notice the other object types that can also be scanned. Check the boxes for each object that you wish to scan. Select the Rubrik-Demo1 cluster, then click Next.
Confirm that the objects you wish to scan with this new policy are correct, then click Confirm.
A complete initial analysis will automatically take place on the objects you specified, in line with the newly defined custom Analyzer and Policy. Progress of this scan can be monitored on the Policies dashboard.
This might take a short while, so move on to the next section - you can come back and check on this later in the lab.
Having access to this kind of information is invaluable. Keeping track of where you have sensitive data in your environments means that you can take the actions required to secure it - maybe you need to move it to secure locations in your filesystems, or maybe you shouldn't be holding that data at all. Visibility into the what and where of sensitive data is a major challenge.
You can now create a report for the legal team, so they know what sensitive data is held, where it resides, and who has access to it.
Navigate to Objects, then select zaffre-webapp-01.
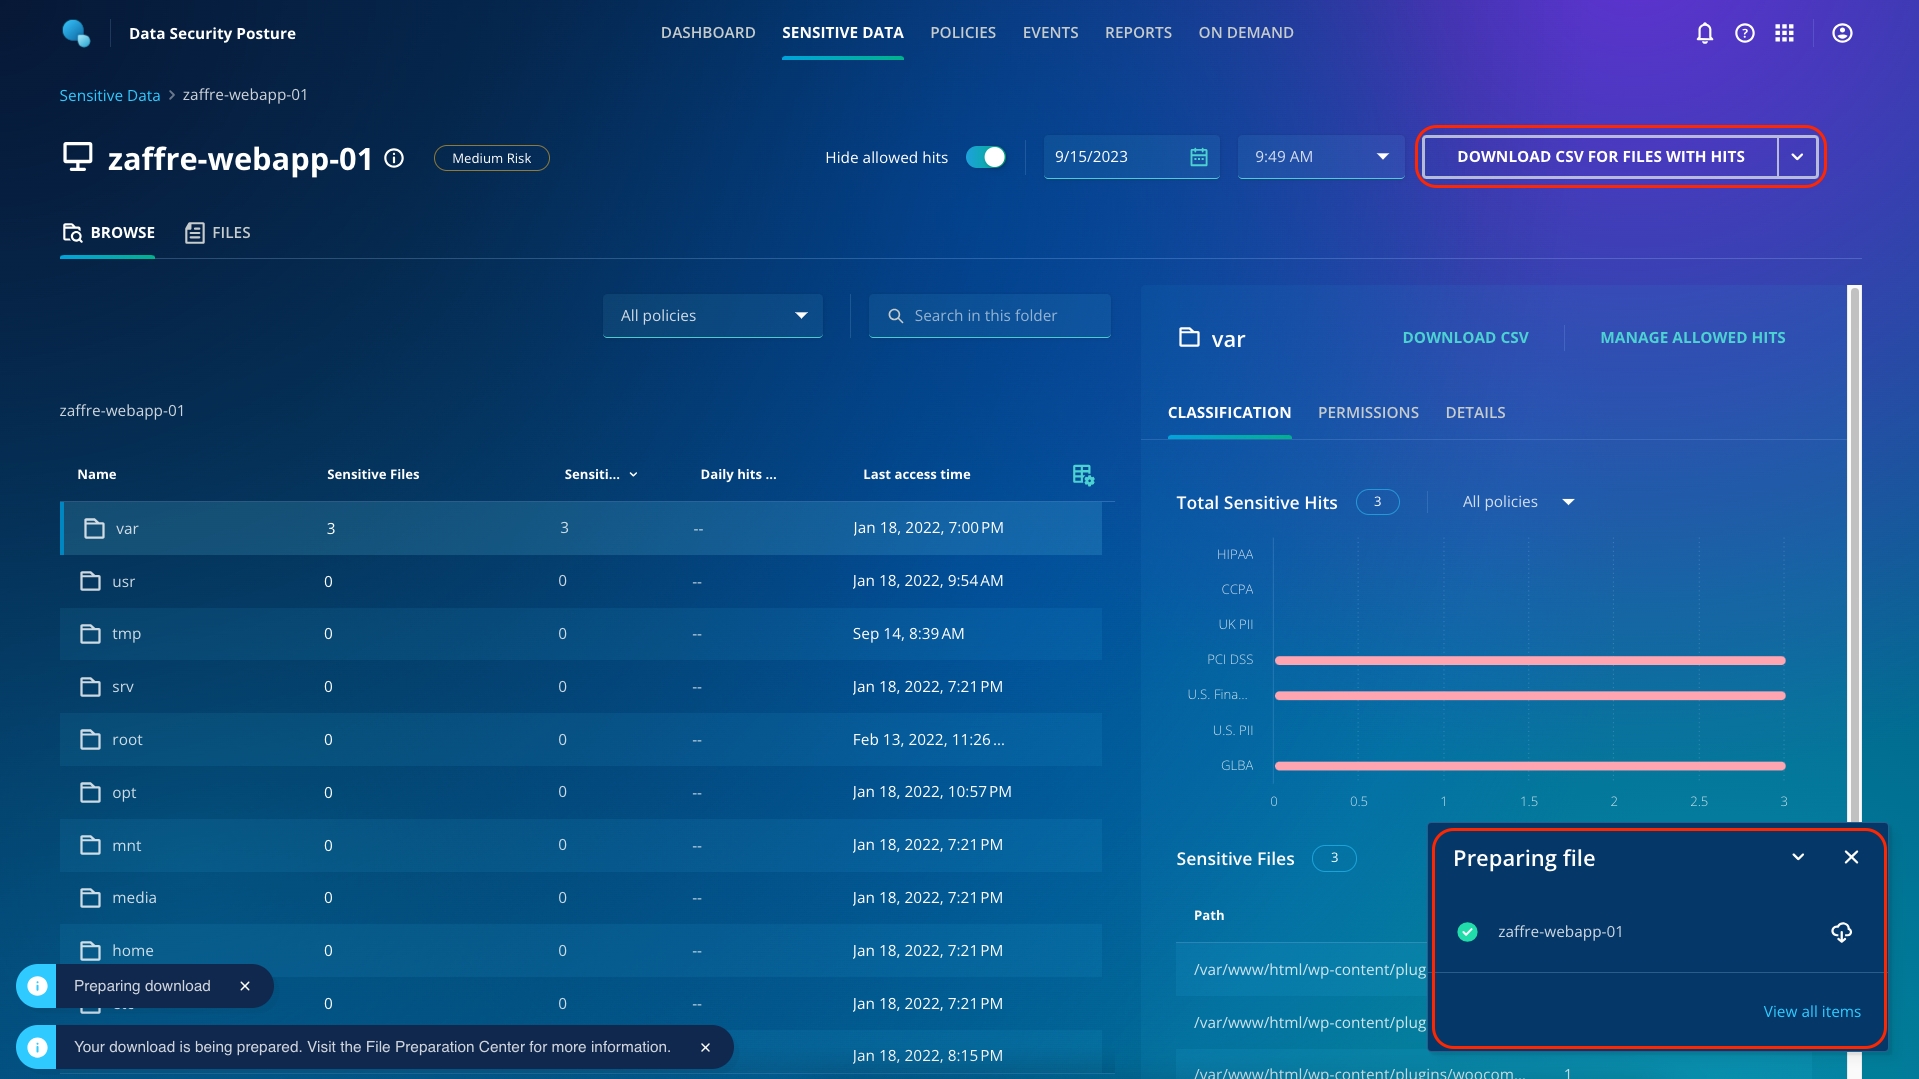
From this screen, click Download CSV For Files With Hits, and you'll notice that Rubrik creates the file in the background for you.
When it's ready, you can click the Download button to download the file.
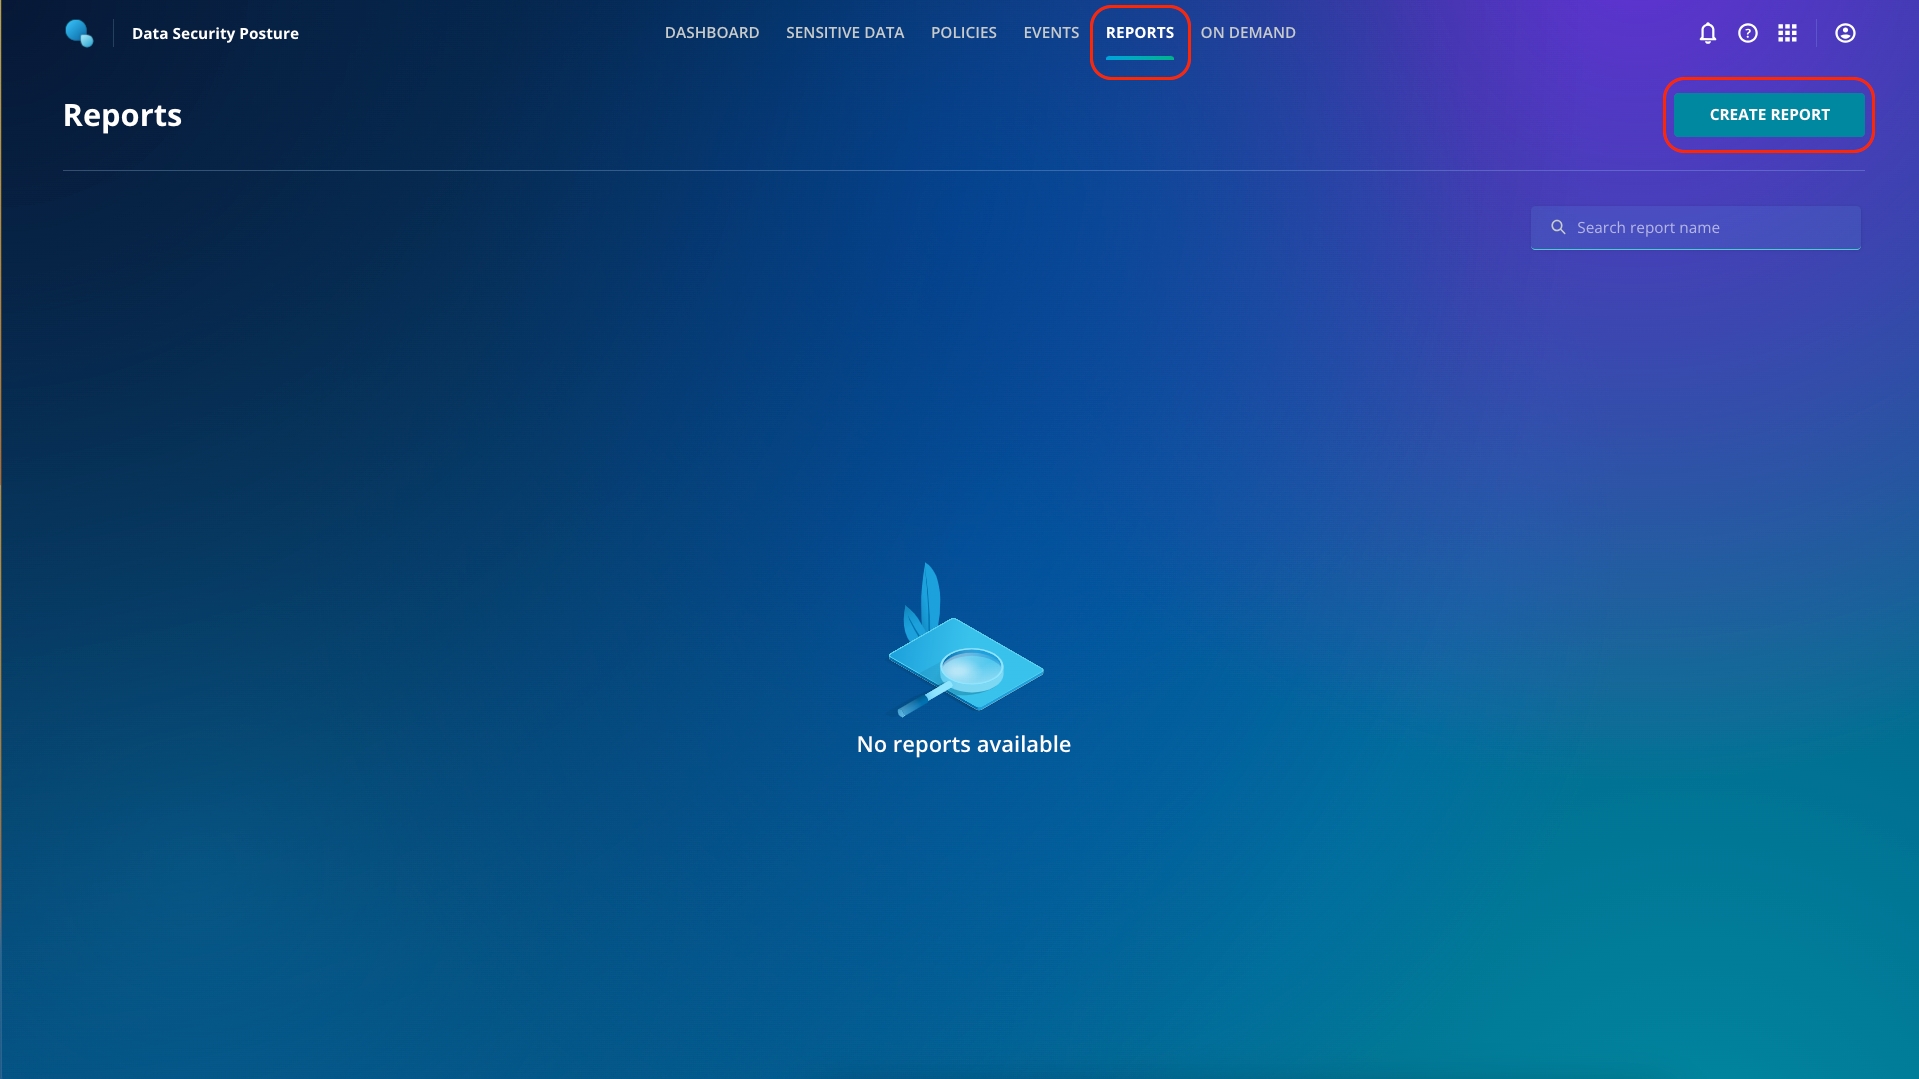
You can also create a little more in-depth report, by using the Reports function. Browse there now.
Click Create Report.
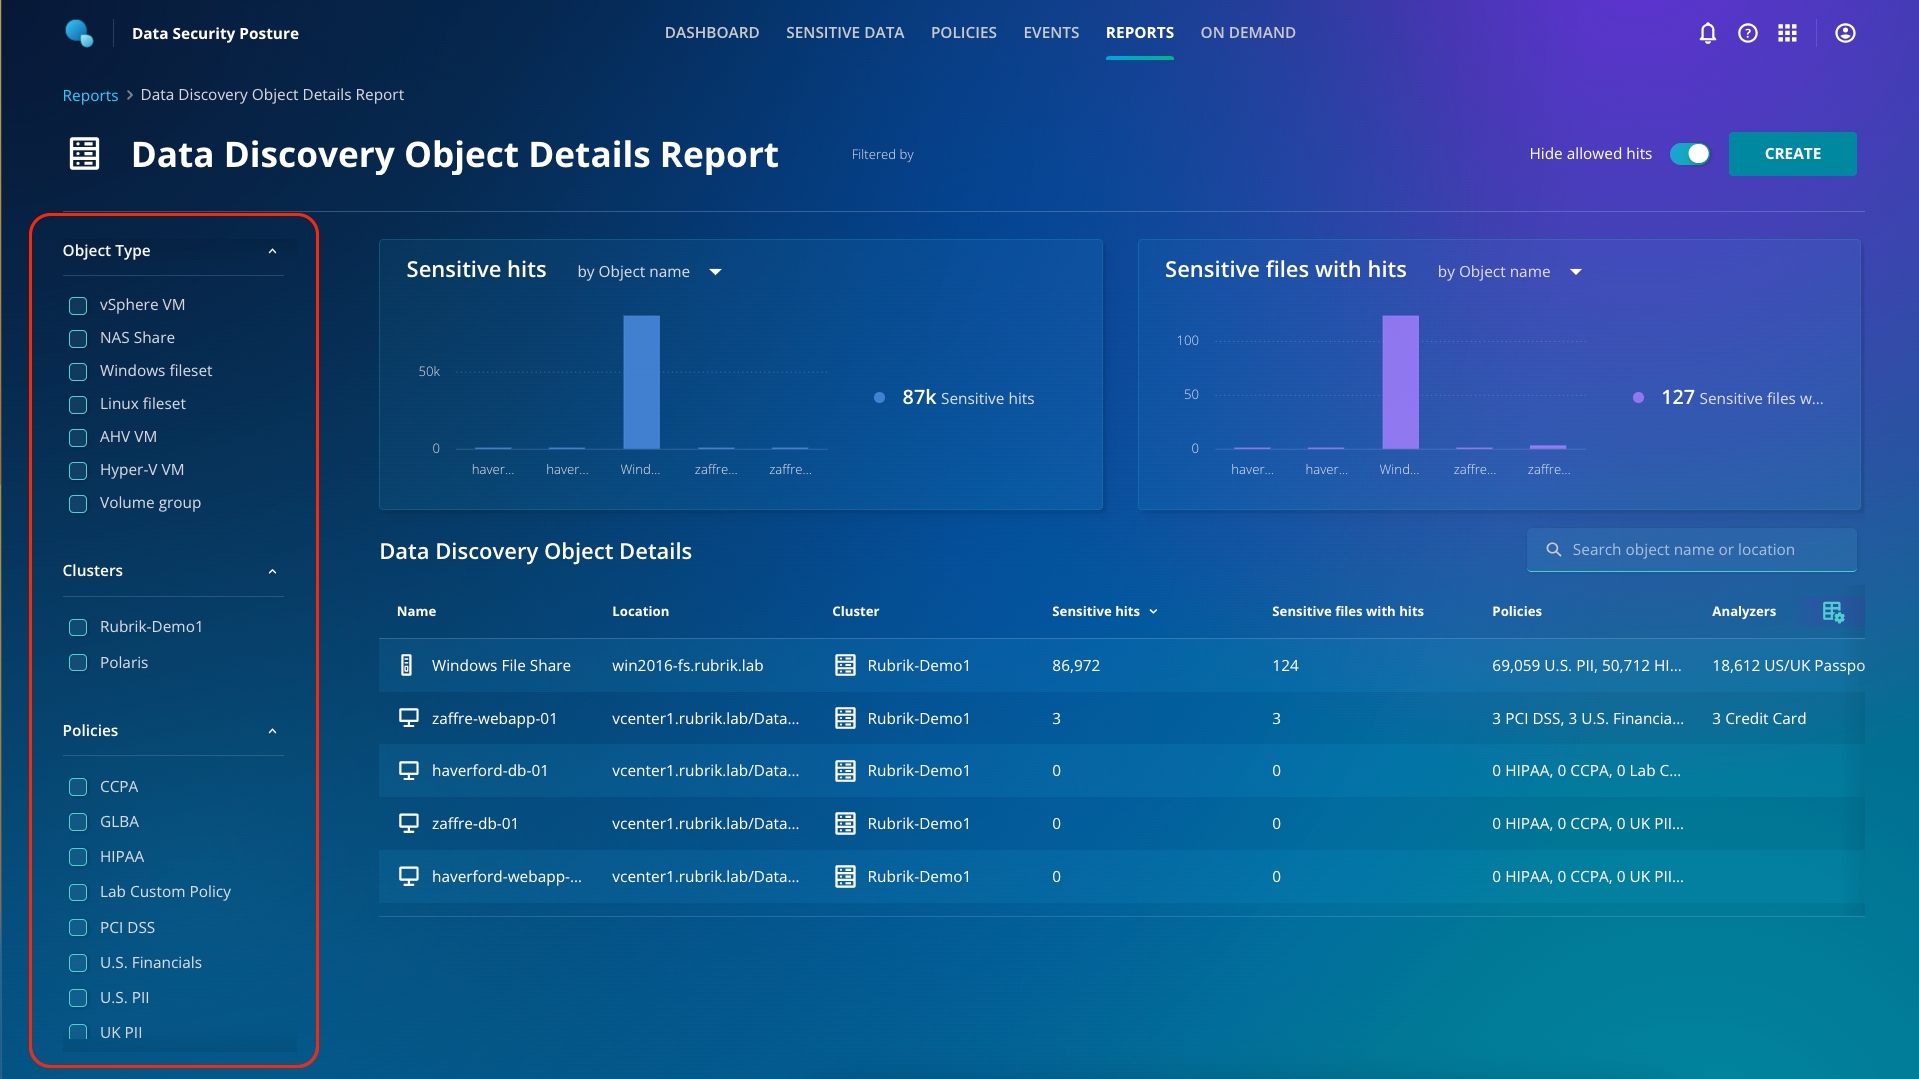
To the left of the screen, you can see the various different types of workloads that Sensitive Data Discovery can analyze: vSphere, AHV, and Hyper-V VMs and also NAS, Windows, and Linux filesets. You can also select across multiple Rubrik CDM clusters. Finally, at the bottom, you can select from the policies defined in this environment.
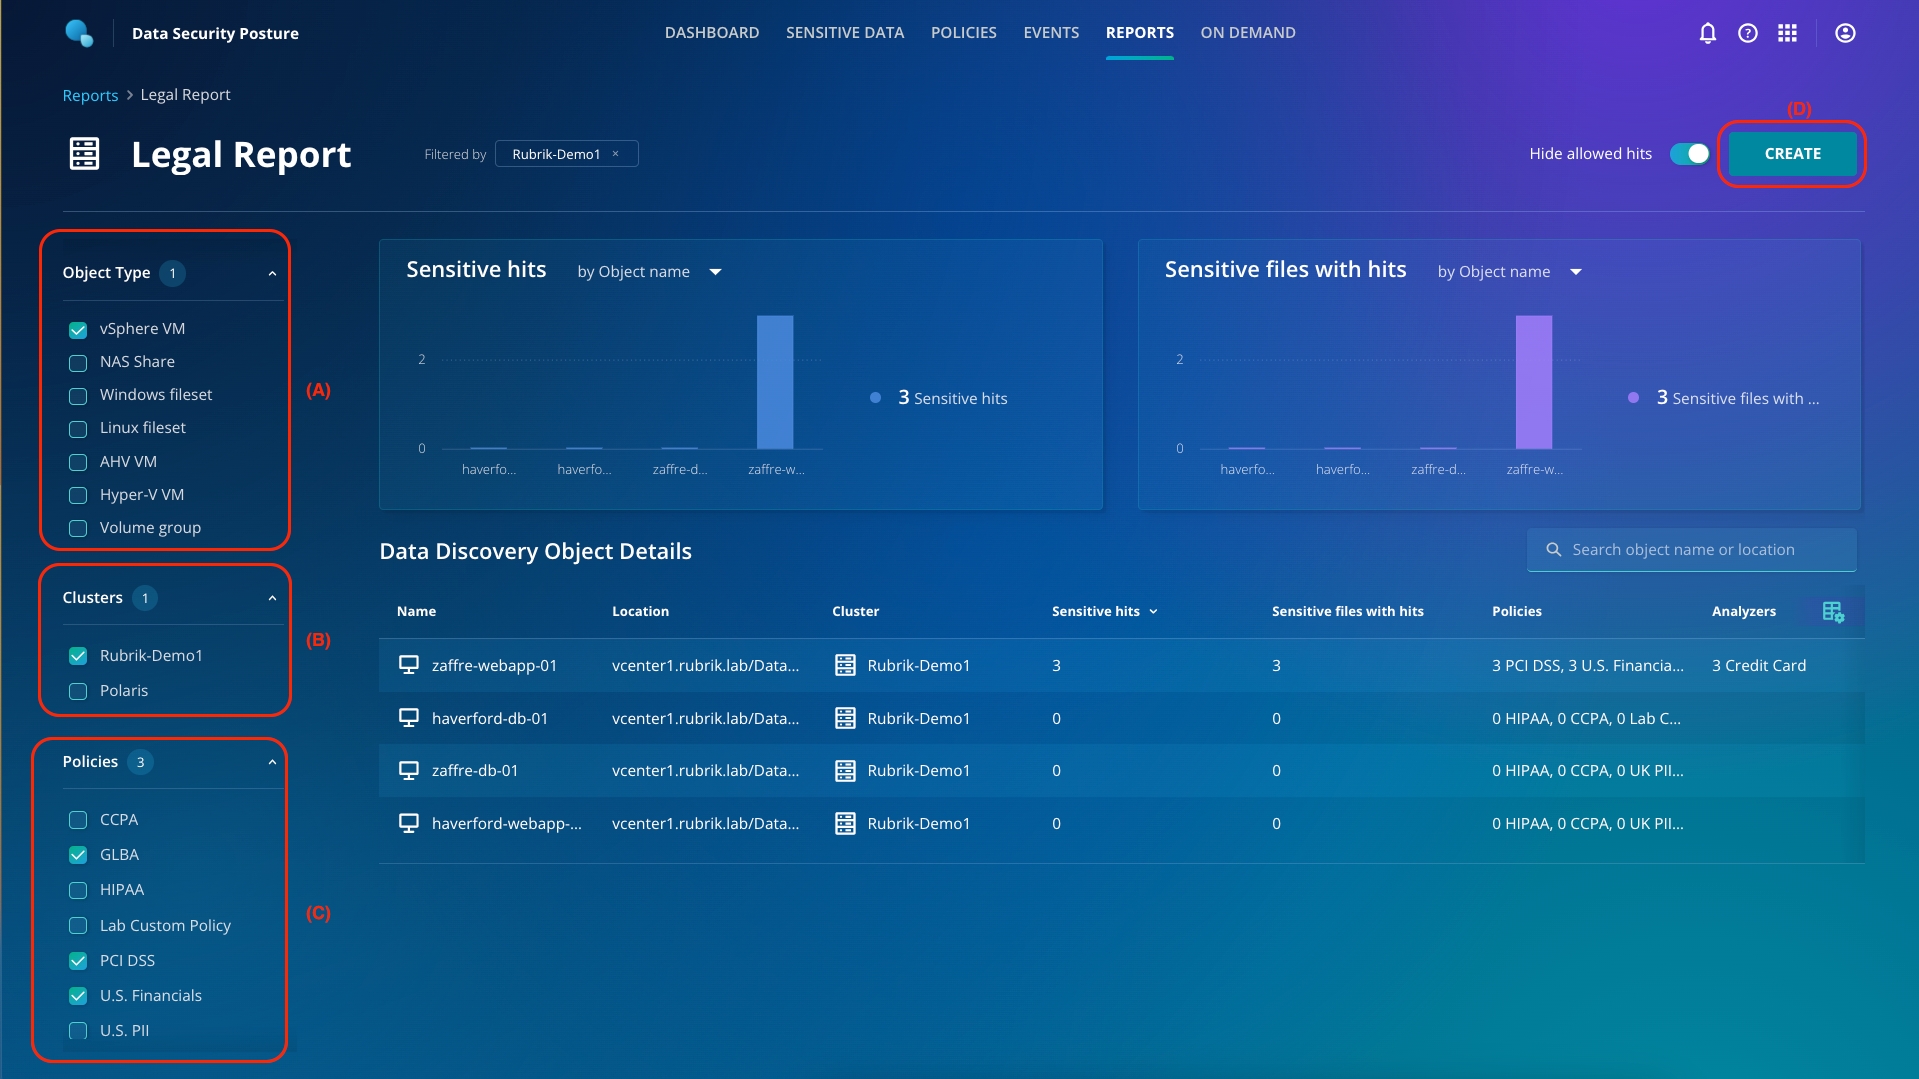
Create a report for vSphere VMs (A), on the Rubrik-Demo1 cluster (B), for US Financial, PCI-DSS, and GLBA (C). Click Create (D).
Once this report is saved, click on the ellipsis button. Generate and download the PDF, which you can ship to the legal team!
You can download sensitive data reports, which can be used by legal and compliance team!
Can you REALLY recover from a cyber attack? Ransomware will impact your environment disproportionately, leaving some assets infected and others clean. Learn how Rubrik solves that problem in this lab.
Cybersecurity authorities have observed a global increase in sophisticated, high-impact ransomware incidents against critical infrastructure organizations. Essential sectors of infrastructure including Healthcare, the Defense Industrial Base, Emergency Services, Food and Agriculture, Government Agencies, and Information Technology Sectors have been attacked. Victims of the most significant cyber and ransomware attacks of 2021 were hit with ransom demands totaling nearly $20 billion globally.
The Rubrik Security Cloud is designed from the ground up to ensure organizations can get the data back if they are ever affected by ransomware. Unfortunately, that is just the beginning of the journey. How do organizations know what to recover and which recovery points to recover from? Was sensitive data in scope? Have you identified and disabled the malware strain that wreaked havoc? Do you have a way of orchestrating the recovery of whole applications and not just individual assets? These are the questions Rubrik set out to answer with our Rubrik Security Cloud that closely aligns to the NIST framework, the gold standard of best practices for protecting their most valuable asset.
This lab will walk you through a scenario designed to mimic a ransomware attack and the associated work that follows. You will see how easy it is with Rubrik to align IT and Security workflows and get back to business quickly.
The traditional approach to handling these kinds of attacks involves the recovery of a server from backup into a clean room, scanning for the malware, and repeating the process until a clean recovery point is identified. This is a painfully long process that can take days if not weeks of iteration in order to identify the clean recovery point. Once this clean recovery point is identified, it can be restored into production or can be used as a launching point for additional forensics.
Time is rarely a resource that is plentiful in the event of such an attack. This continuous iteration is also a blunt tool approach that rarely yields timely results. With Rubrik Security Cloud, you can remove this cycle of pain and also surgically recover impacted files as necessary, minimizing loss of data.
First, click on the link for the Zaffre storefront from the Bookmarks Bar.
Navigate the storefront, browse items, and maybe add a few select items to your cart!
Verify everything is working correctly.
Right-click on the link in the Bookmarks Bar and choose "Open in New Tab" so as to not affect any of your active windows
Now click on the link for the Haverford storefront in your Bookmarks Bar. What do you notice?
Zaffre has the Rubrik Enterprise Edition suite, and now you will leverage the deep integrations to kick off an in-place recovery.
To do this, first switch to the Anomaly Detection app by clicking the Data Threat Analytics in the app-tray in the top right of your screen.
Click the Investigations tab in the top center of the screen. You can see the Haverford_Site Recovery Plan from Cyber Recovery.
From here, you can clearly see suspicious activity, particularly on the haverford-webapp-01 virtual machine. Check the box to select the Haverford_Site Recovery Plan, then click Start Cyber Recovery.
Notice that when you select the app, you can also download a CSV detailing all suspicious activity detected in the component virtual machines.
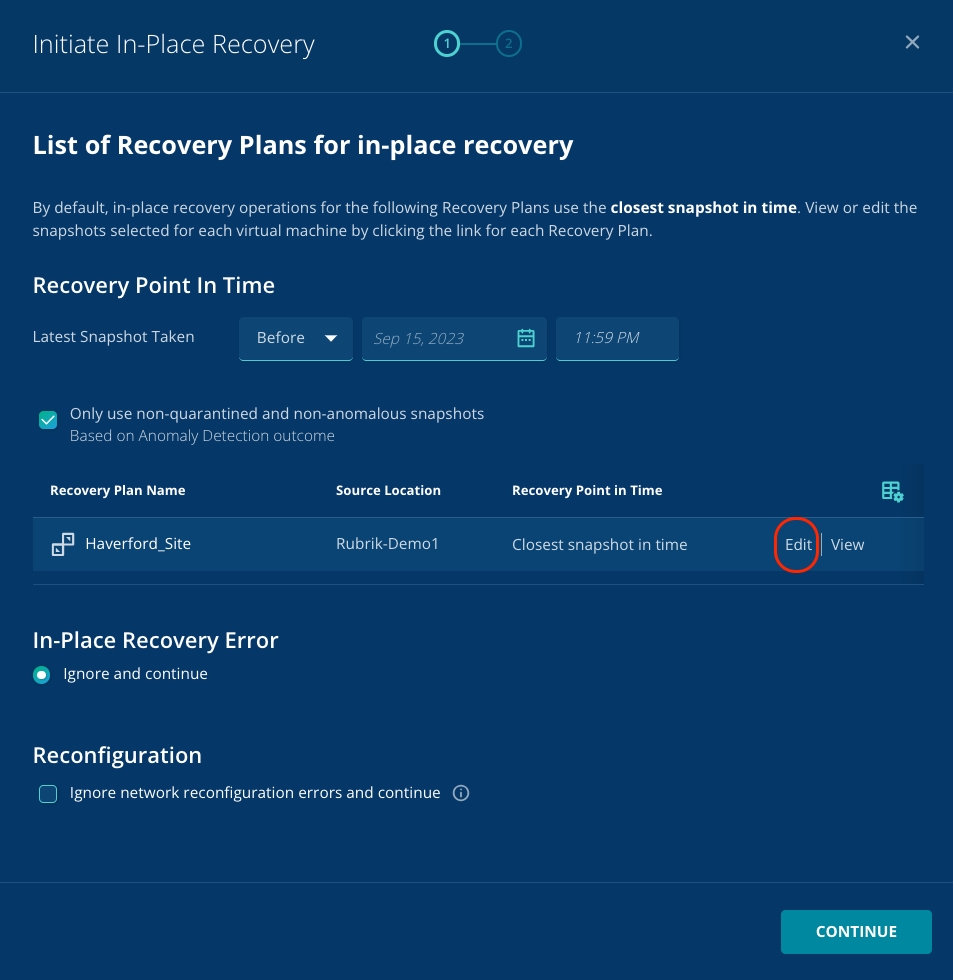
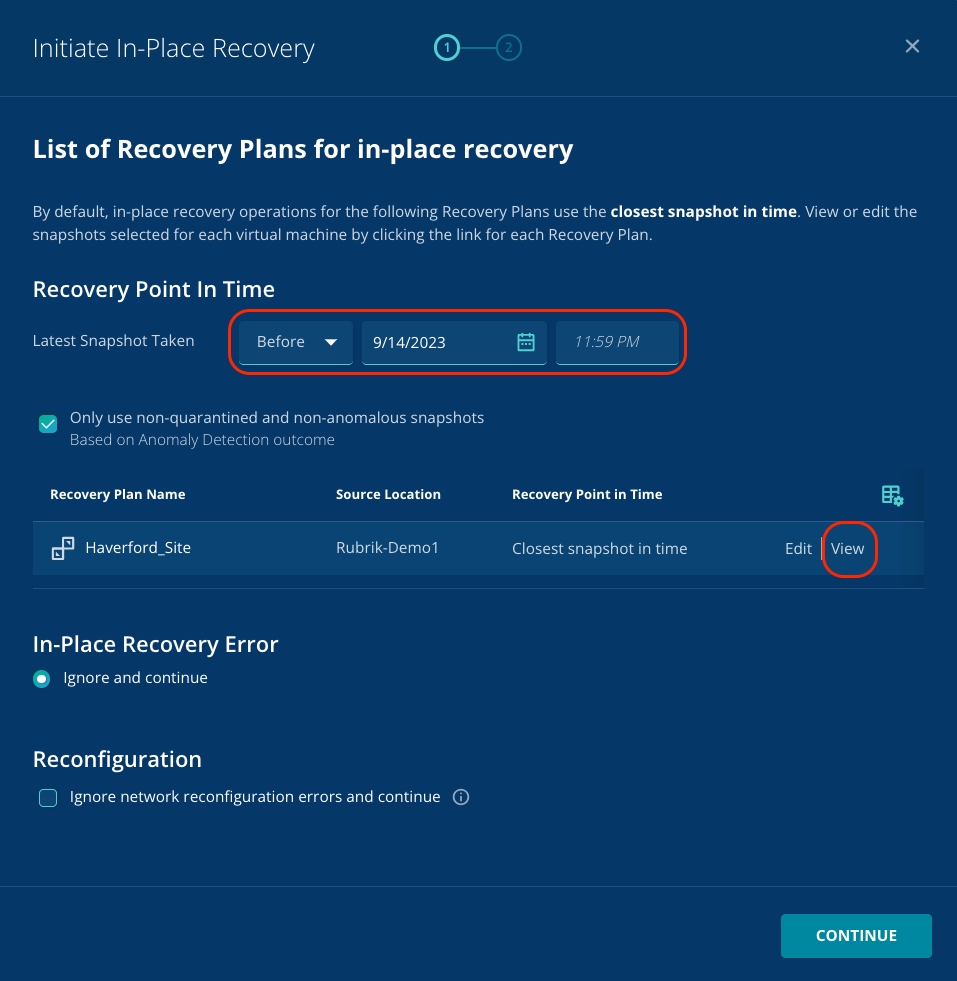
You can notice that this defaults to recovering the VM to the closest snapshot to the point in time that you've selected. As Zaffre is recovering from a ransomware attack, it's important that a clean recovery point is selected.
Click the Edit button for the Recovery Plan.
You need to find a clean snapshot.
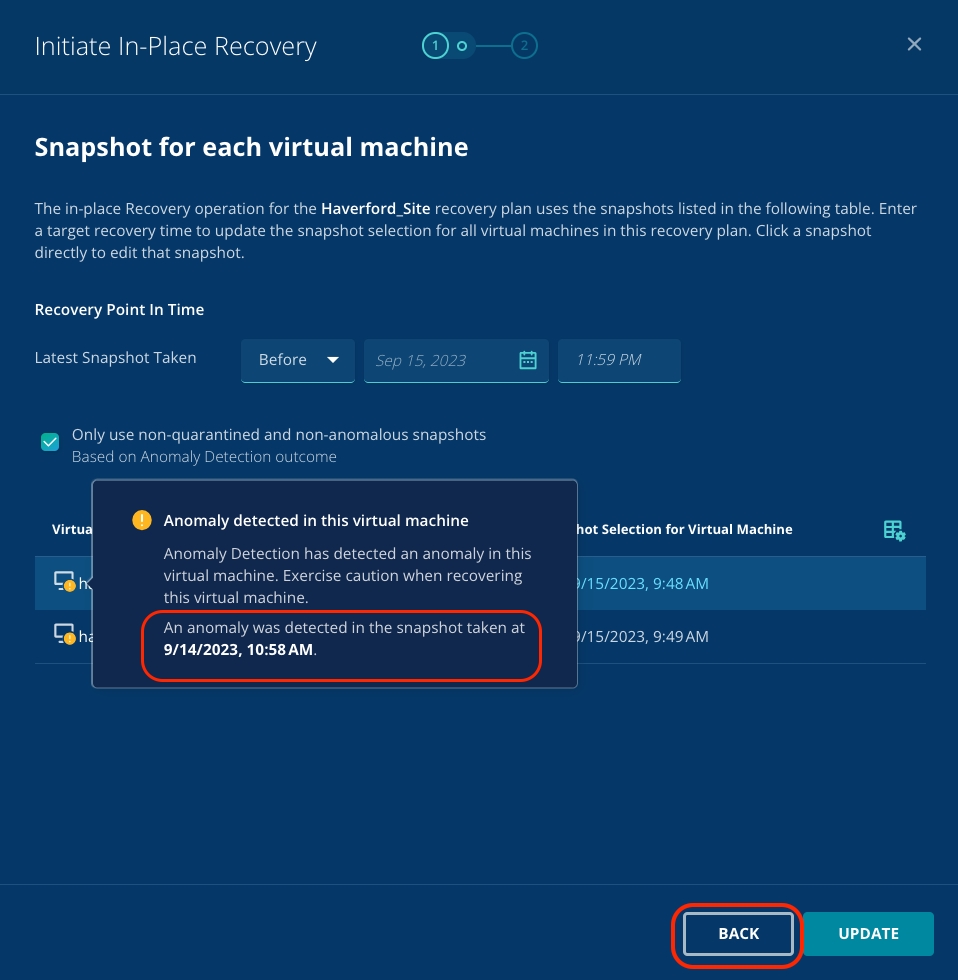
Hover over the Orange circle with an exclamation mark. You can see the exact time when the anomaly was detected. Click Back.
Update the date to be the same as the date of anomaly detection and the time right before the anomaly detection.
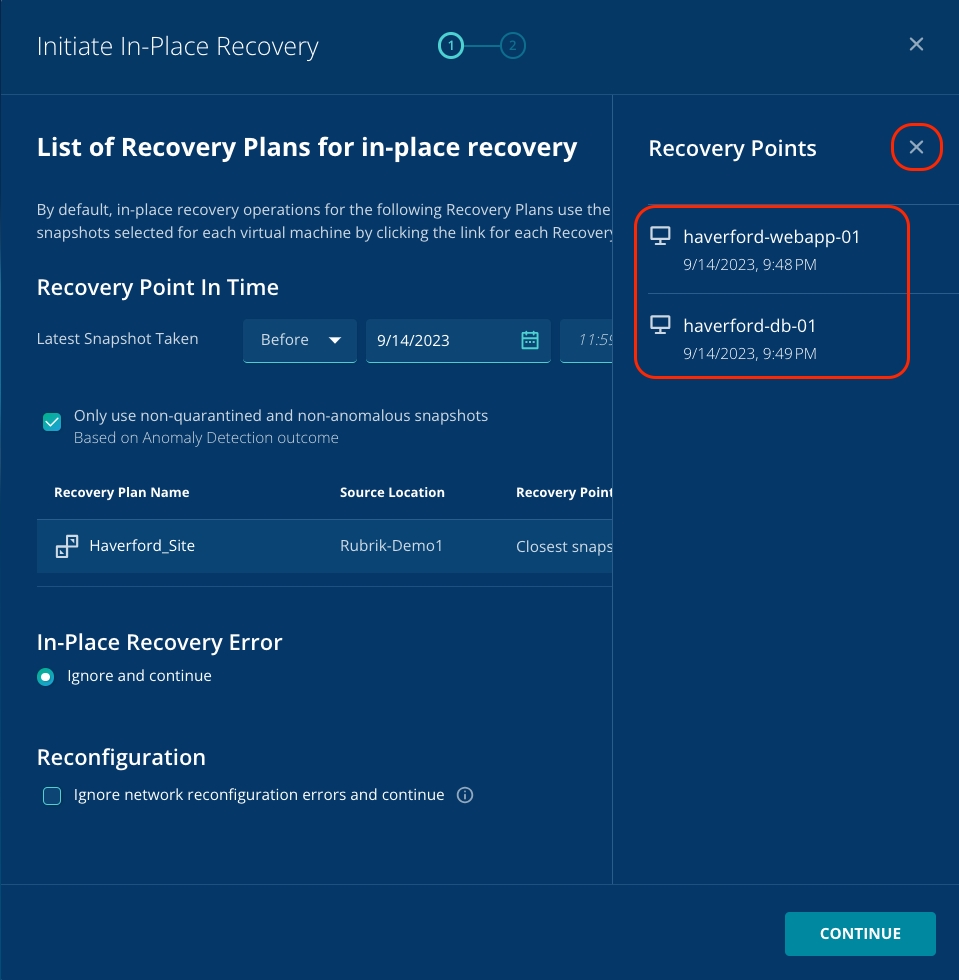
Click View.
You can see that a snapshot is automatically selected with the same date as the anomalous event and the time before the anomalous event.
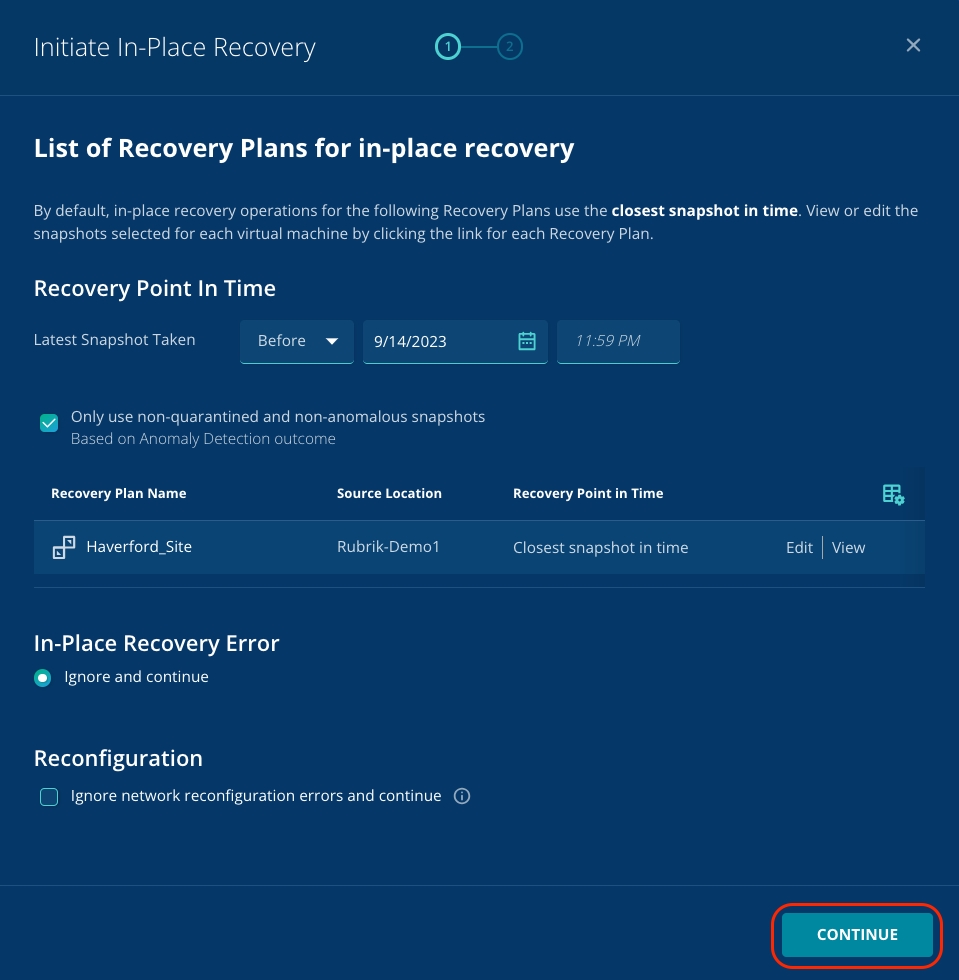
Click X to close the Recovery points pop-up.
Click Continue to proceed.
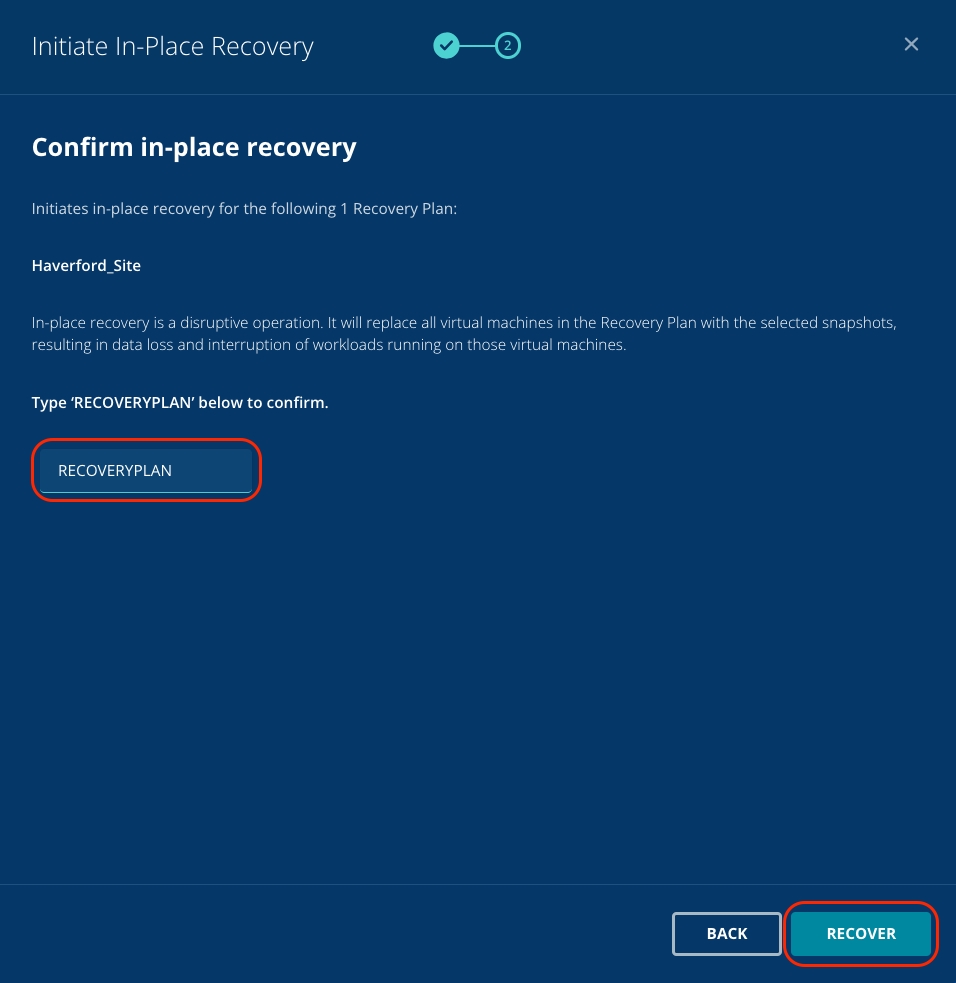
You'll now see a warning. As in-place recovery overwrites the existing virtual machines, you have a final check to prevent accidental clicking: click into the free text field and type RECOVERYPLAN. Once this is done, the Recover button is clickable.
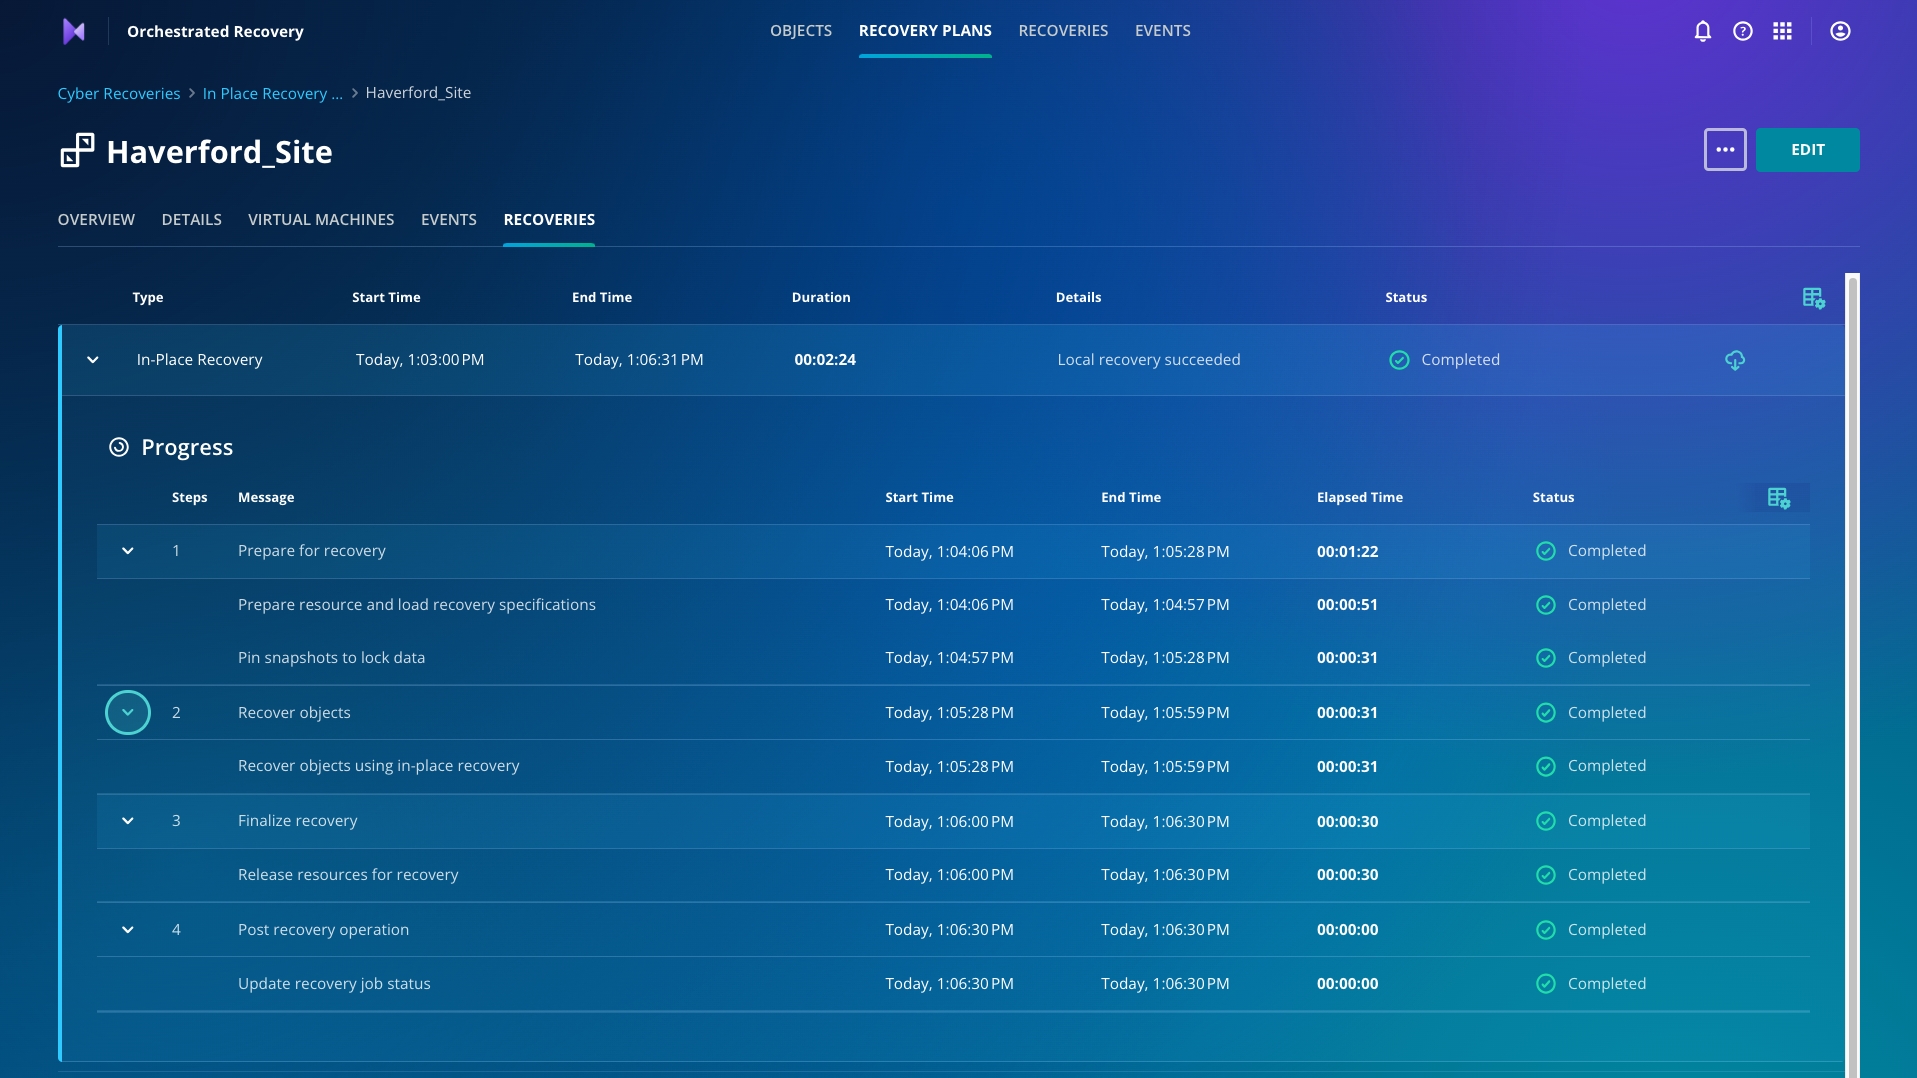
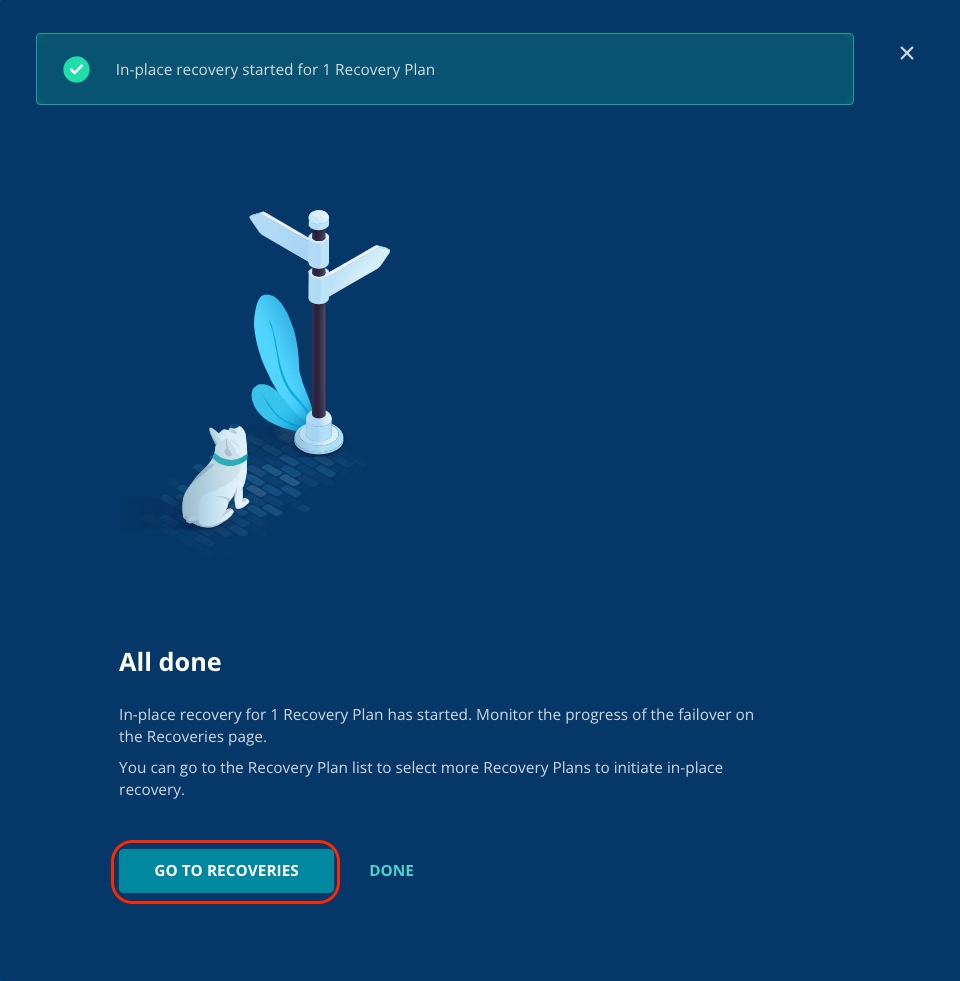
You can now see that the recovery has begun and can track the progress on the Recoveries dashboard. Click Go To Recoveries.
The recovery activity may take a moment to be shown under Recoveries.
Monitor the failover through to completion. This may take a few minutes. Once the recovery is successfully completed, you need to validate that the Haverford website is back up and running.
Open a new tab in your browser, and click the shortcut to the Haverford site. You should see it is back up and running.
Using Cyber Recovery and a few clicks, you got Haverford up and running within the hour vs. days or weeks!
Zaffre has the Rubrik Enterprise Edition suite, and now you will leverage the Cyber Recovery to kick off a recovery in an isolated recovery environment (IRE) to run forensic analysis. You can also use this to validate your clean snapshots before recovering into your production environment to ensure you don't reinfect your production environment.
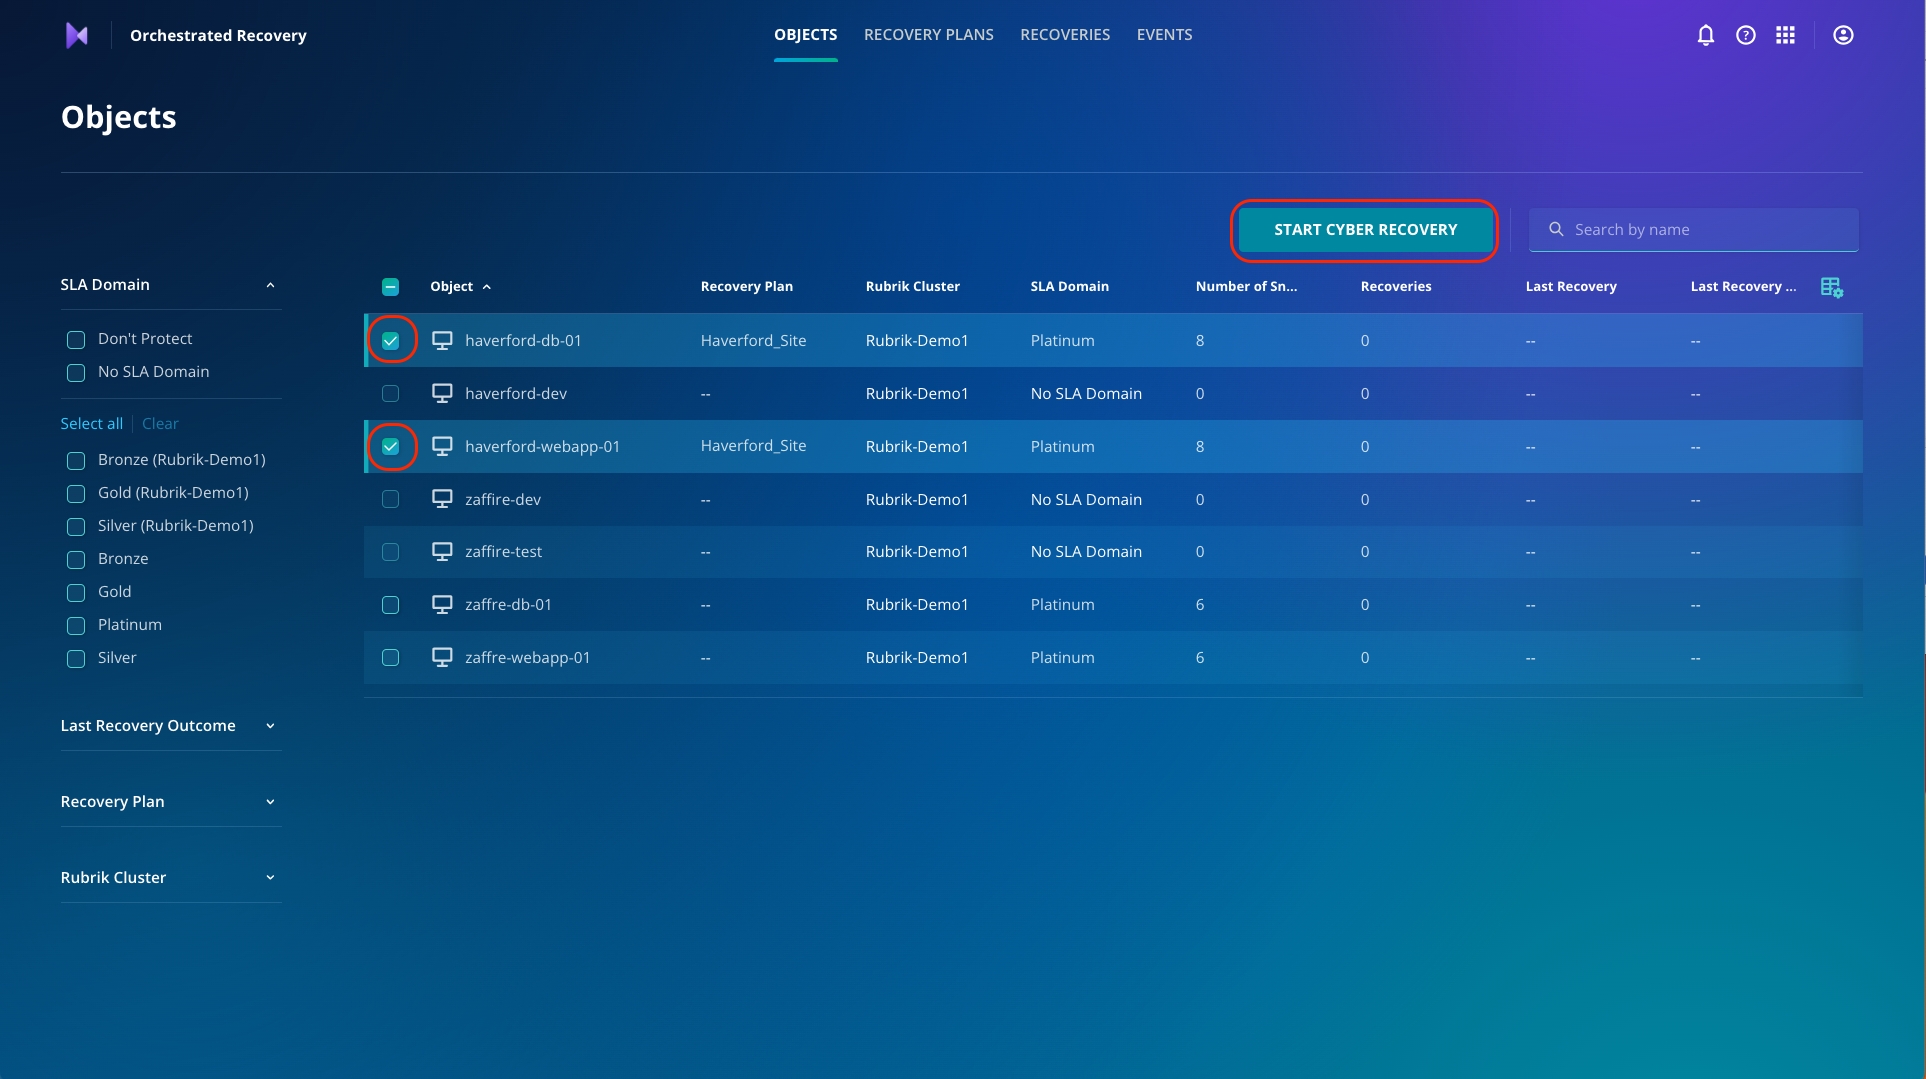
To do this, first click the Objects tab if you are not already there.
Click Start Cyber Recovery.
Click Start to kickstart the Cyber Recovery wizard.
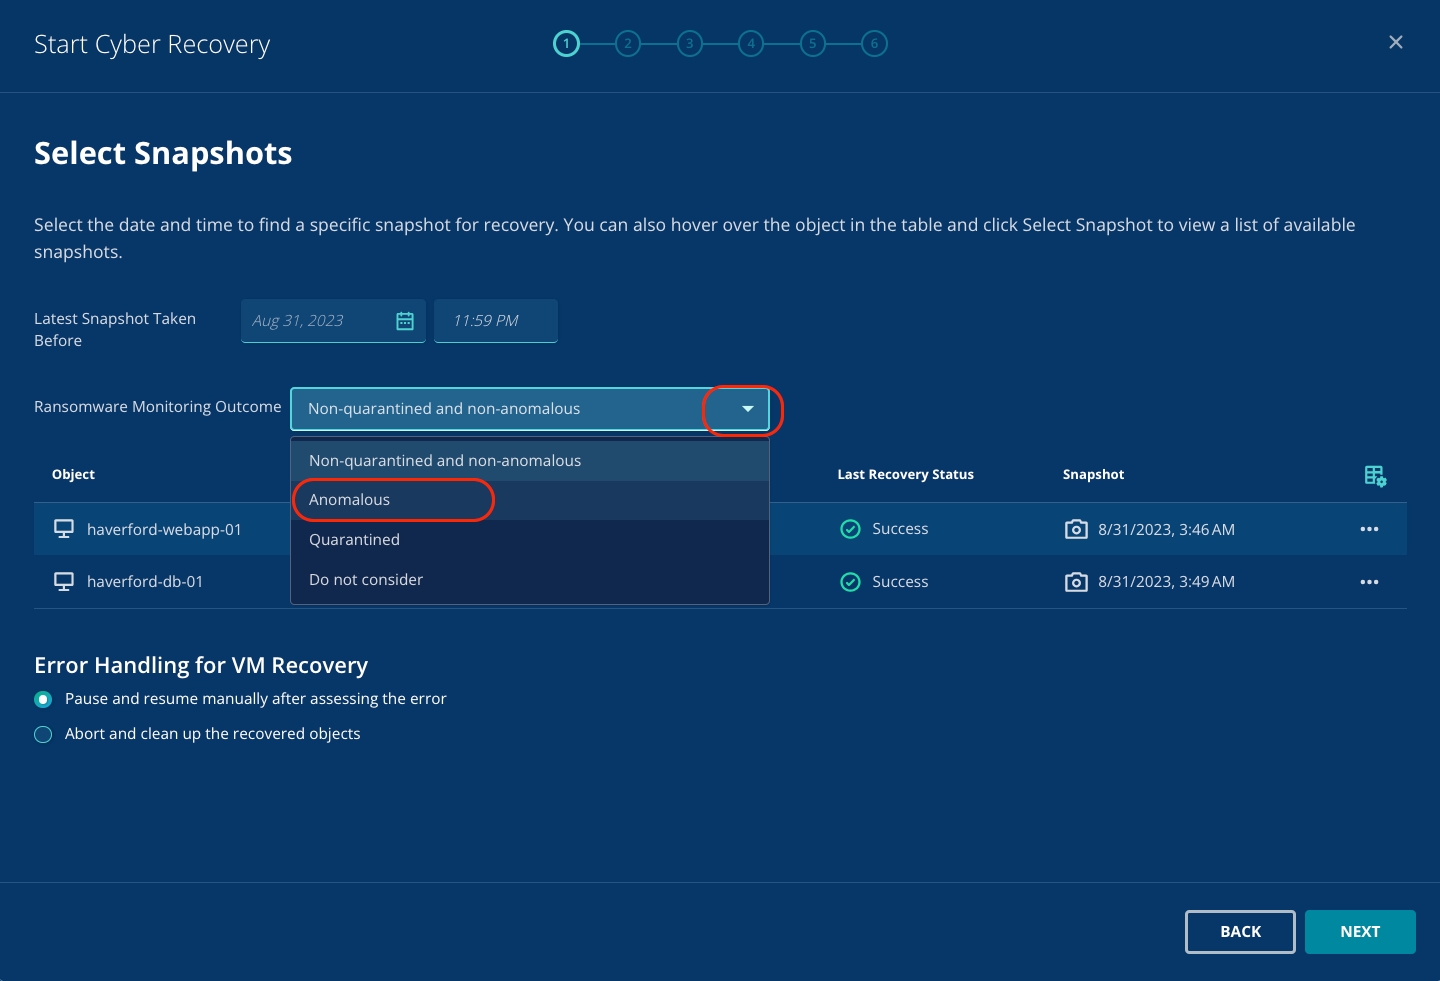
Next, from the dropdown menu for Ransomware Monitoring Outcome, select Anomalous.
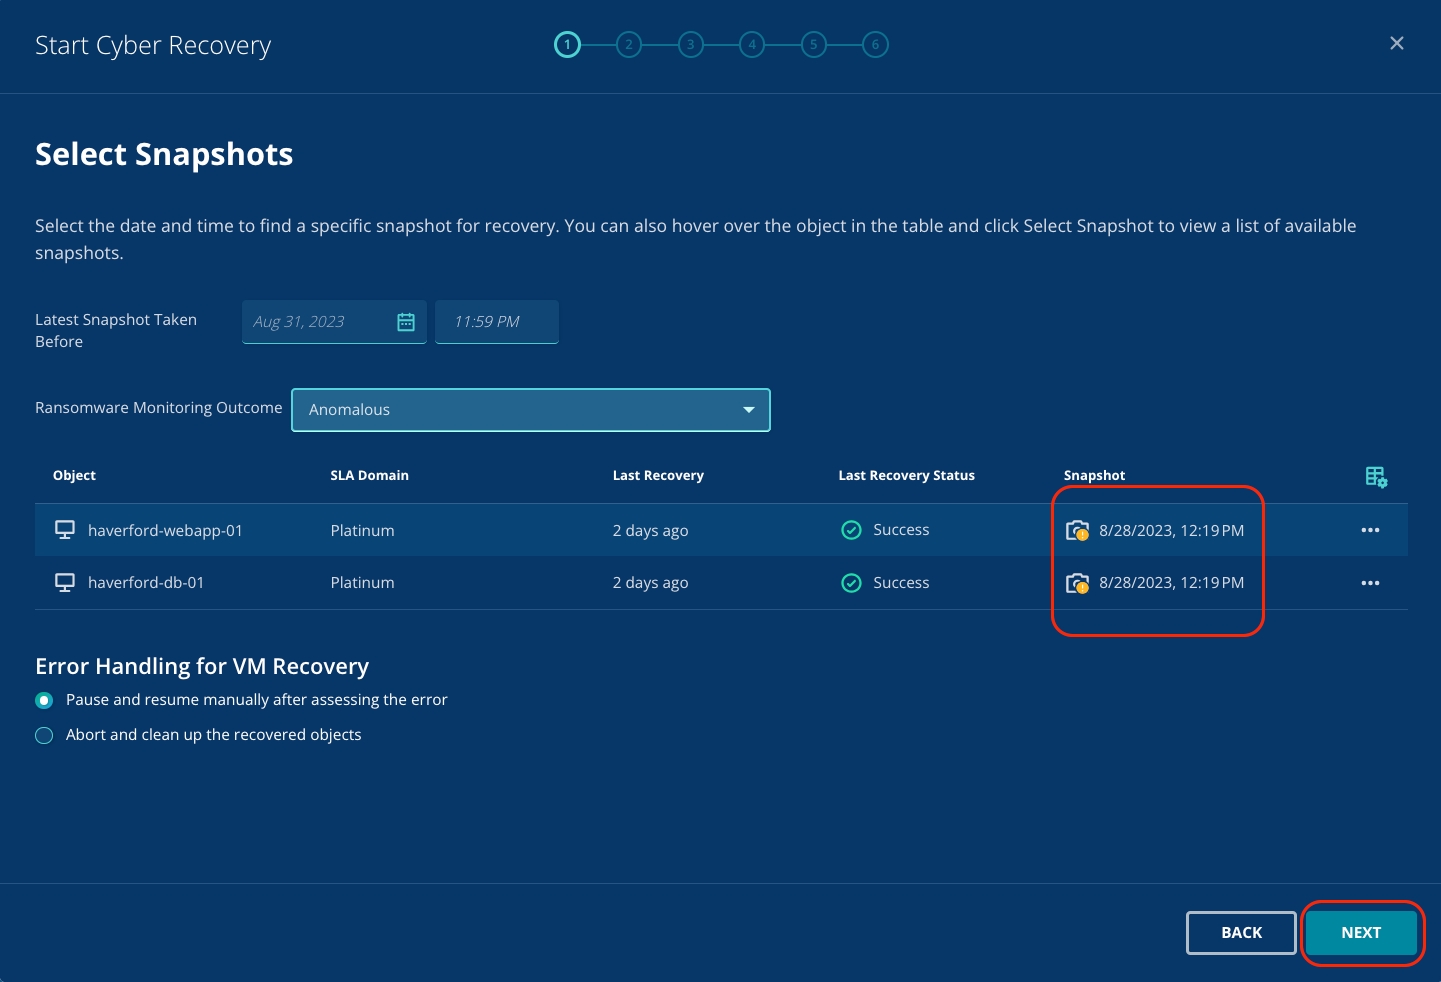
You will now see that Rubrik has automatically selected the anomalous snapshots for both VMs.
The automatic identification of anomalous or non-anomalous snapshots saves you a lot of time and effort and allows you to run forensic analysis and recovery quickly to get up and running quickly!
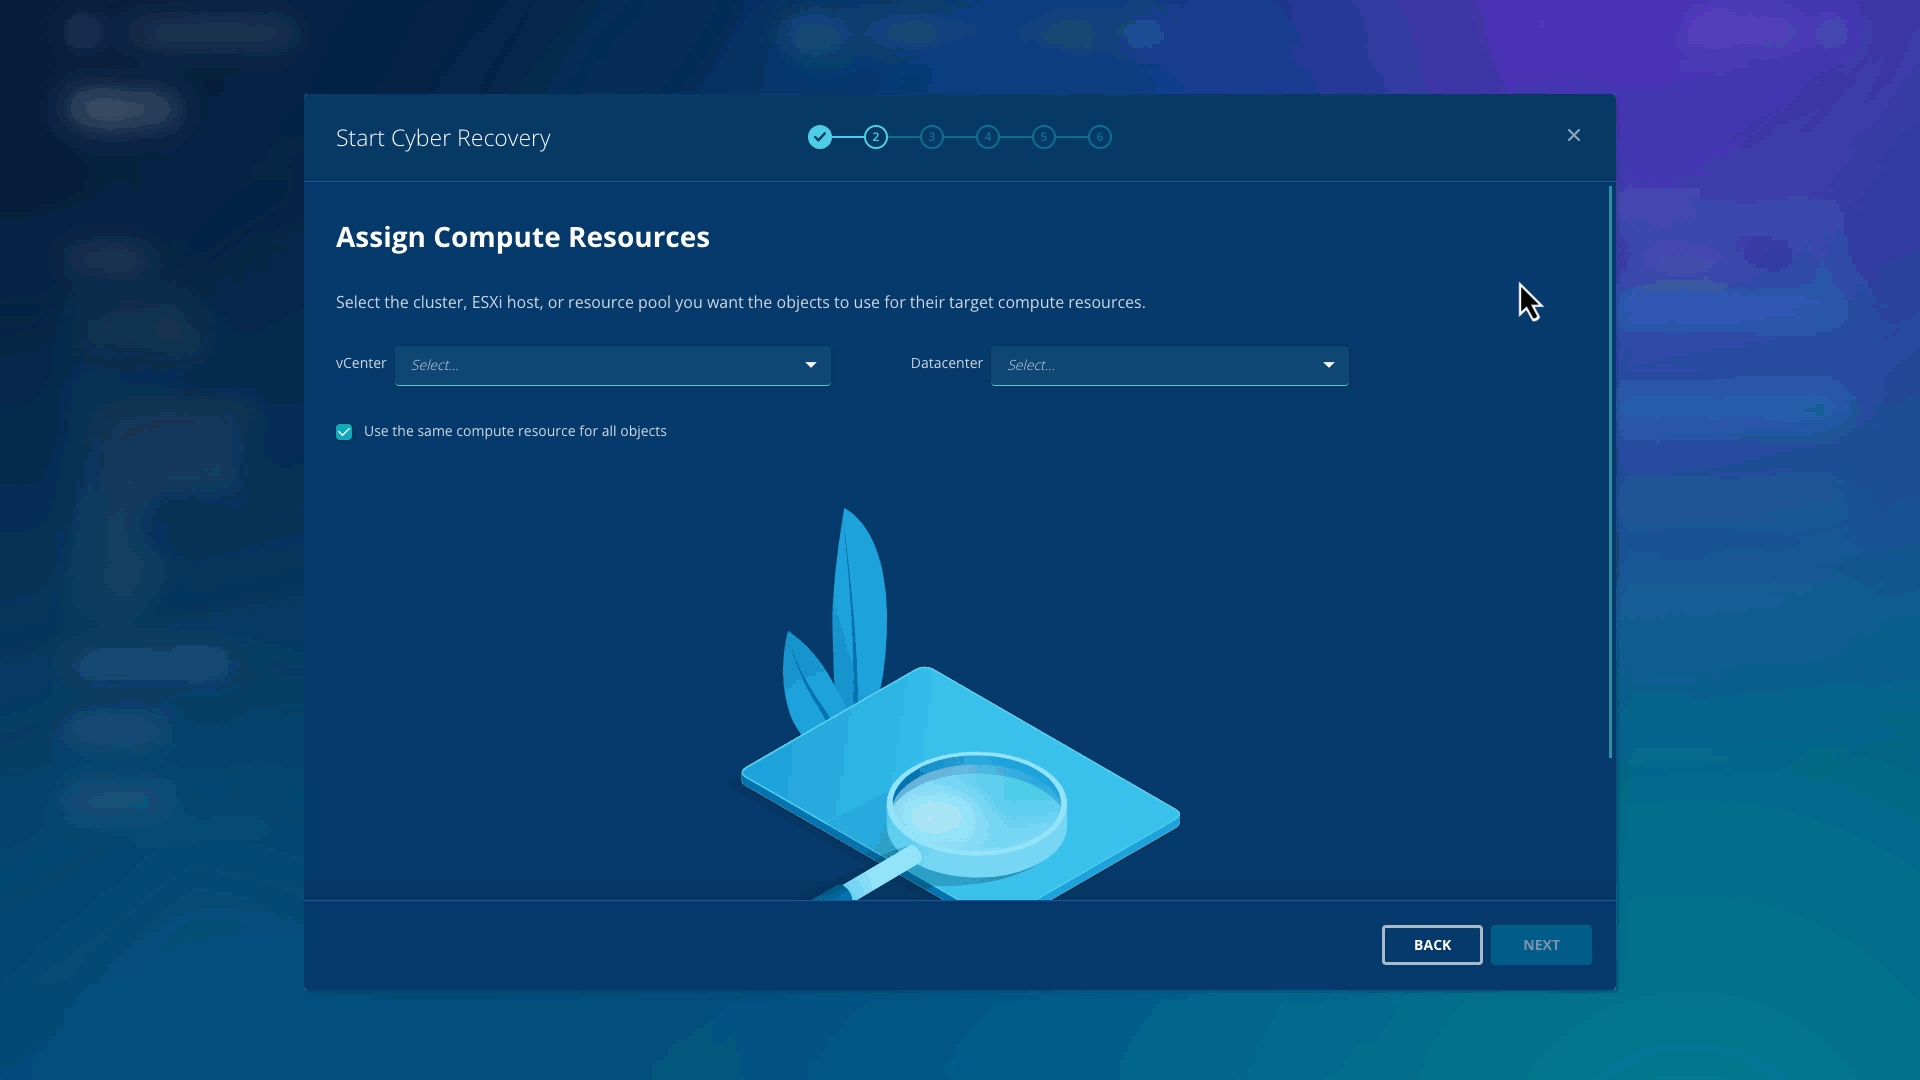
To assign compute resources, select the default vCenter from the dropdown menu.
Select the default Datacenter from the dropdown menu
Select esx2.rubrik.lab as the compute cluster.
Click Next.
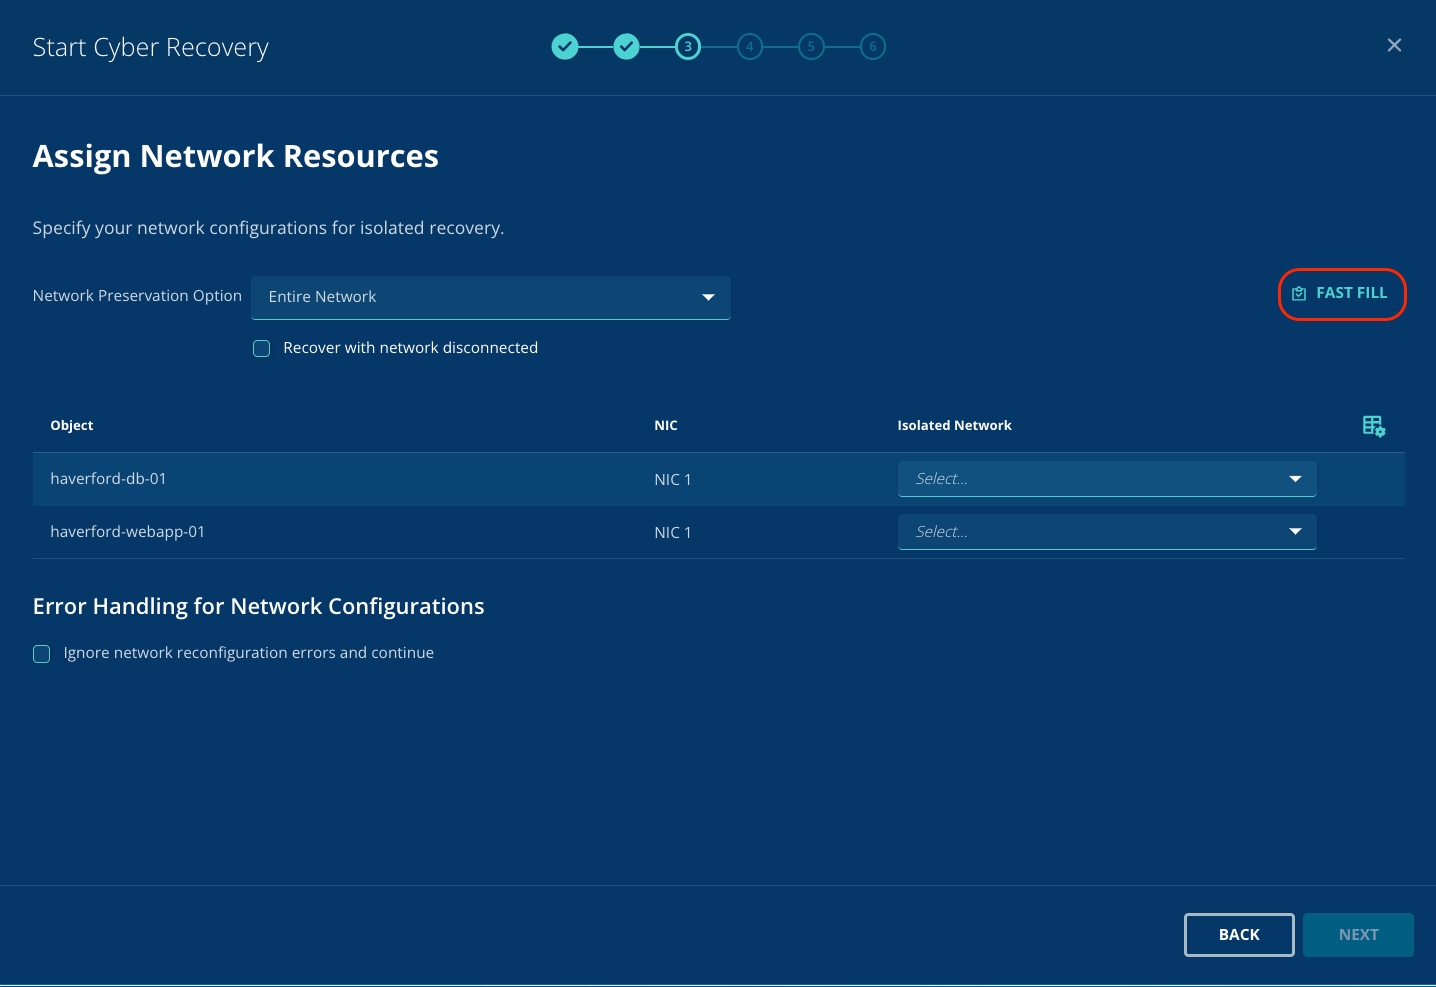
To select the Isolated network for all the VMs, select Fast Fill.
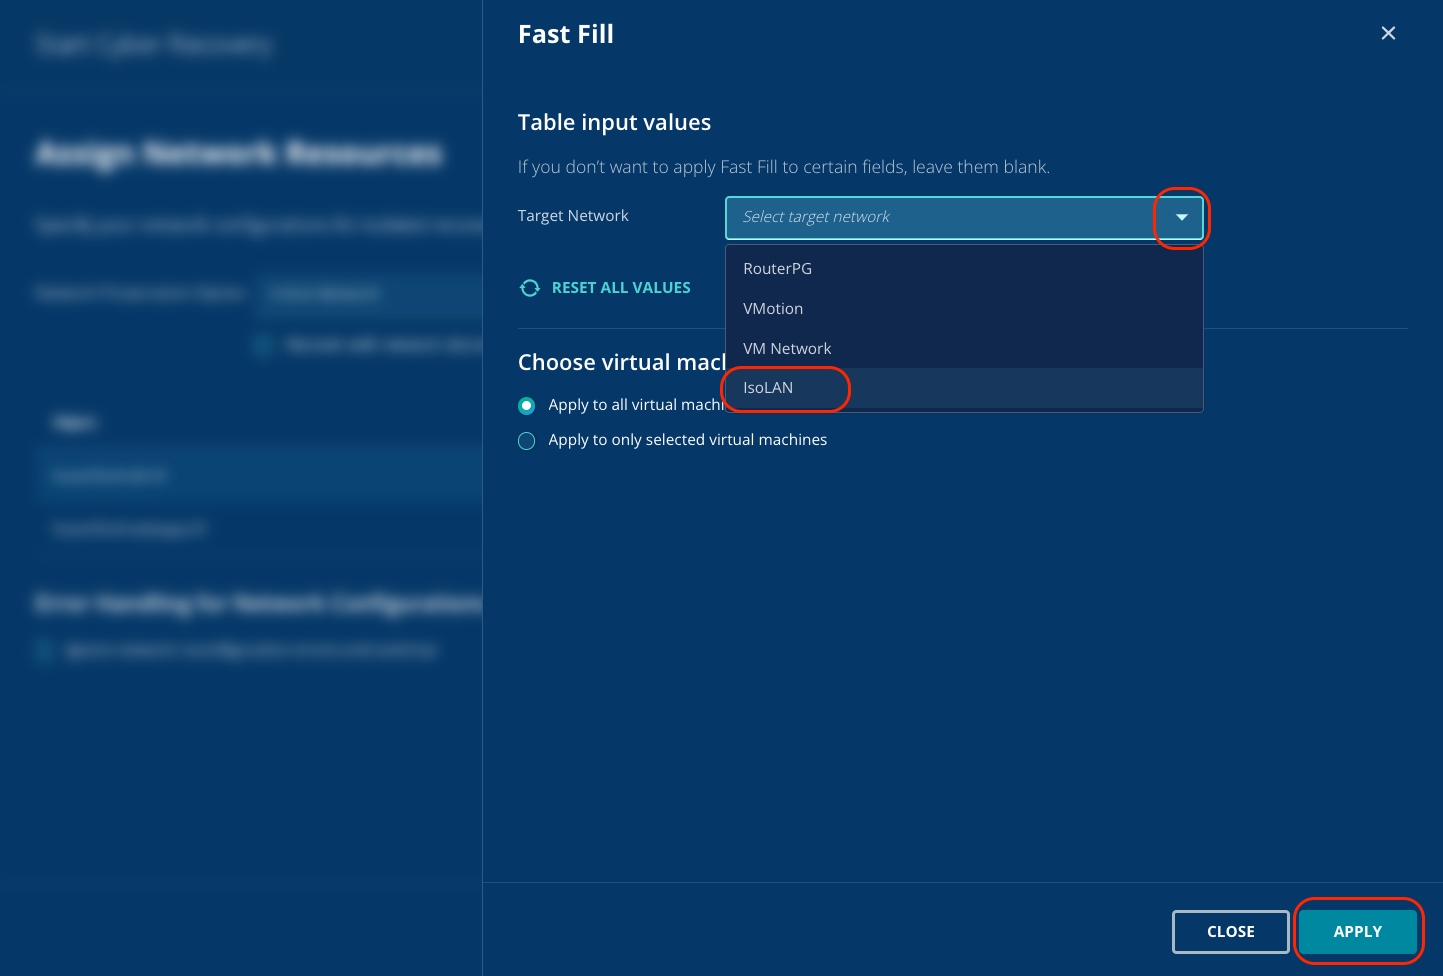
From the dropdown menu, select IsoLAN and select Apply.
You will observe that the Isolated Network is automatically selected for the VMs.
Click Next.
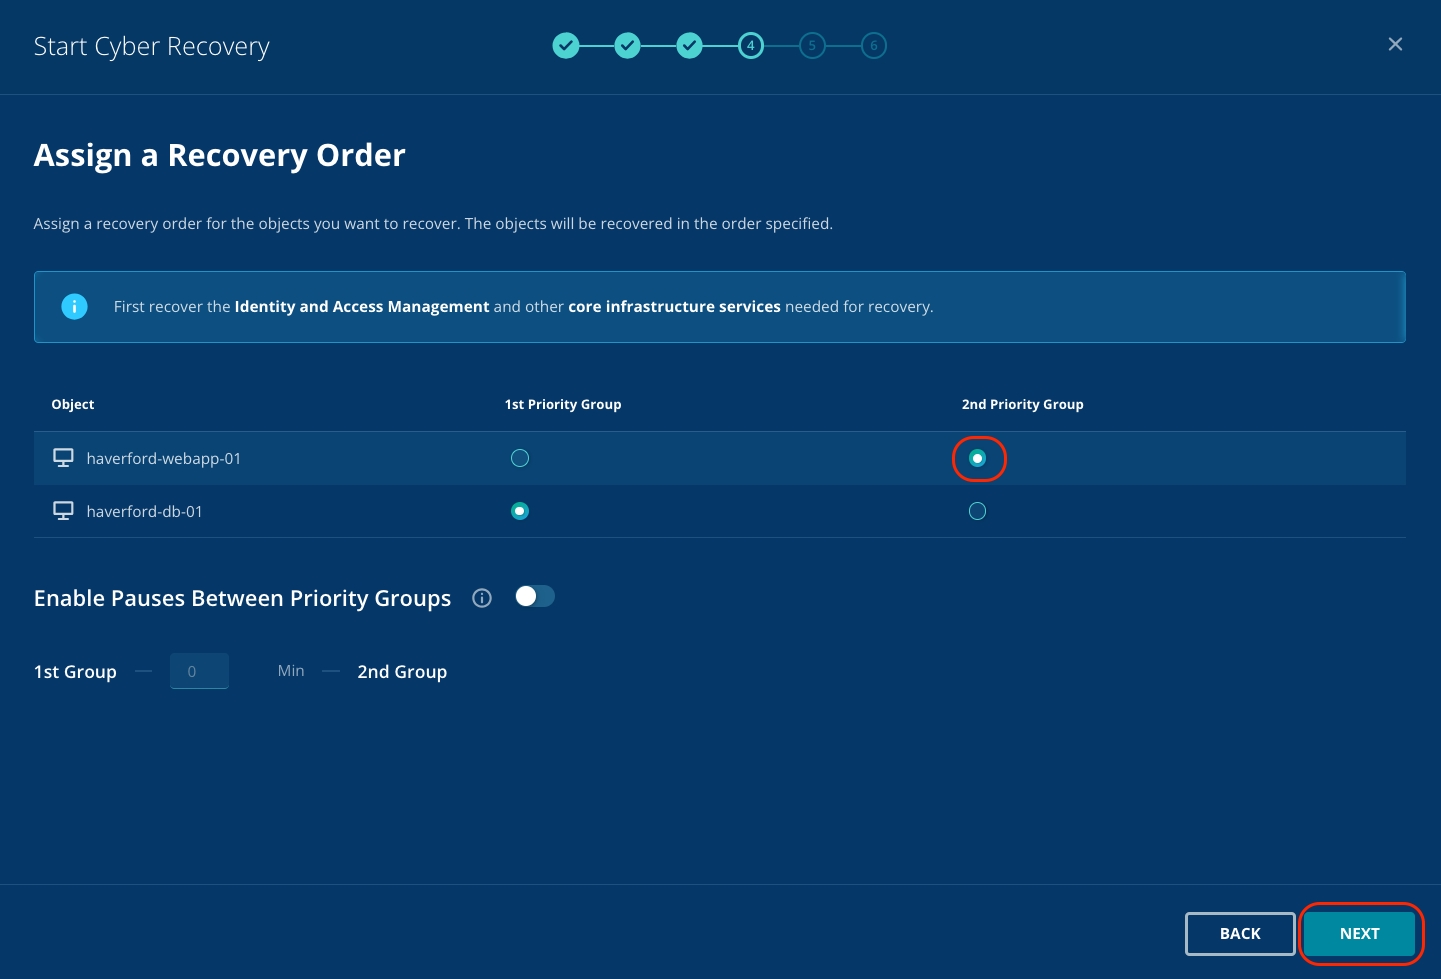
Assign 2nd Priority Group to haverford-webapp-01.
Click Next.
Click Next.
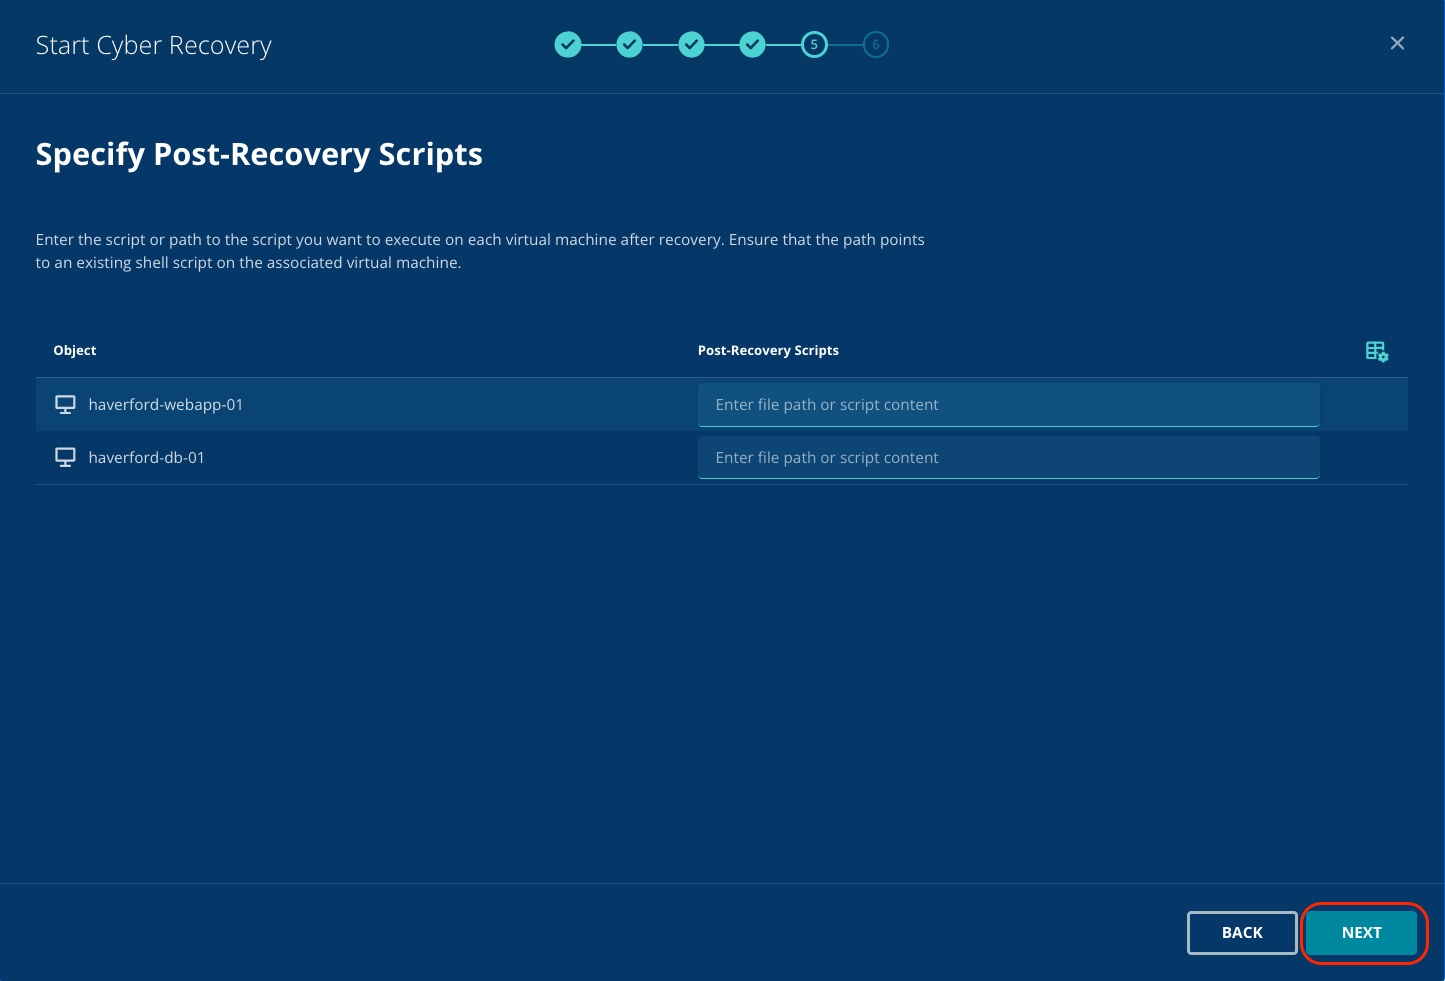
Post-recovery customs scripts are used for testing ransomware or disaster recovery scenarios in any environment. This helps identify potential recovery weaknesses before the real threat re-occurs in your production environment.
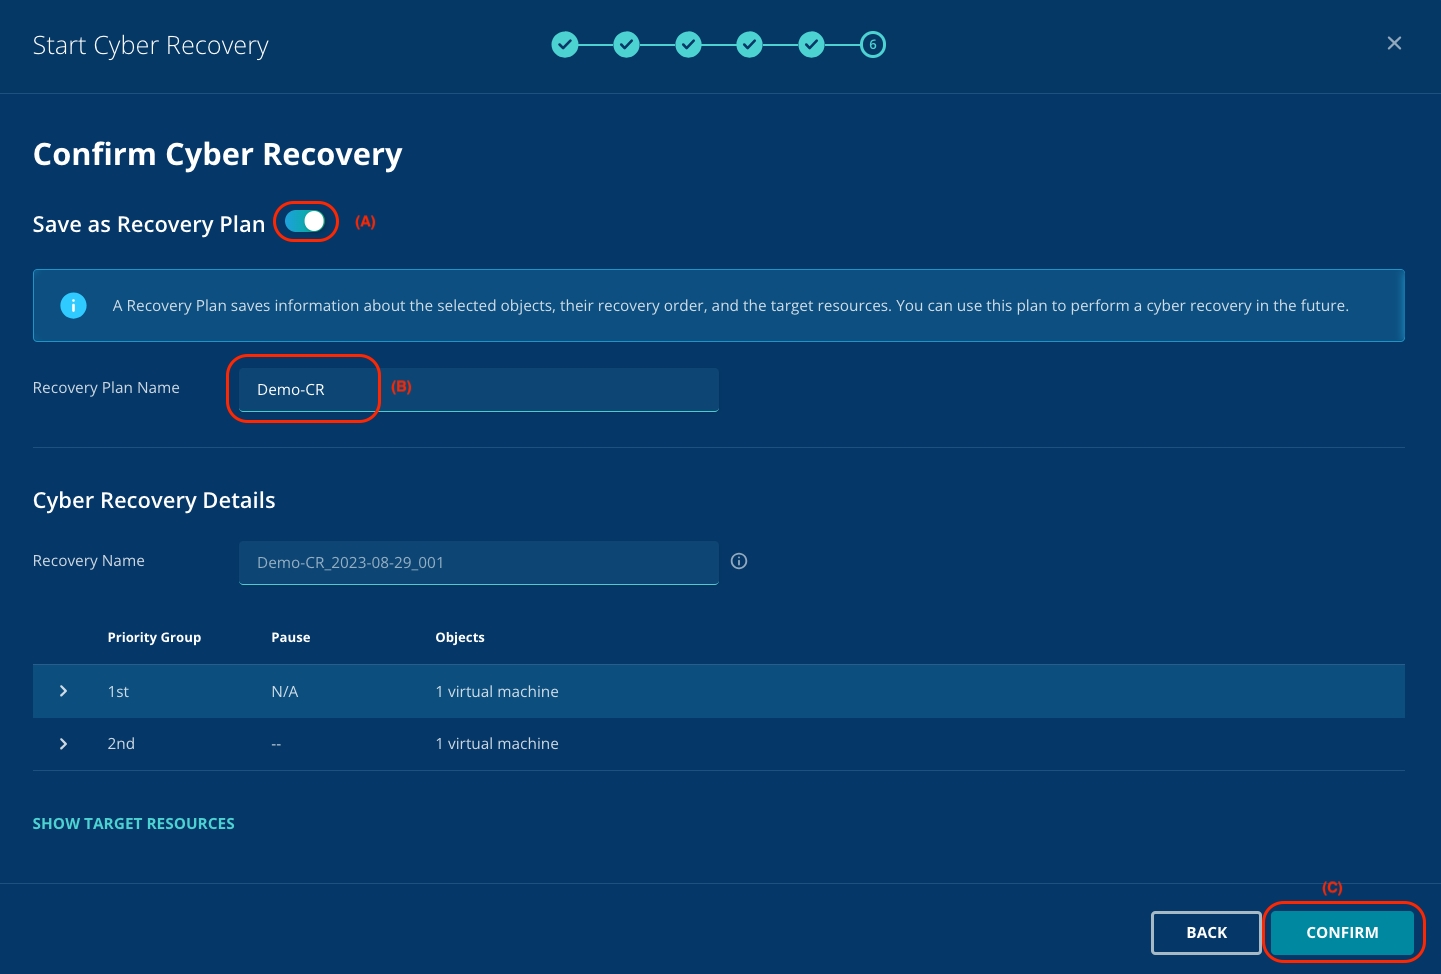
Toggle the button (A) to save the recovery plan to use in the future
Type Demo-CR (B) as the Recovery Plan Name.
Click Confirm (C).
Saving Recovery Plans enables you to kick start cyber recovery in the future without needing to identify and define resources again.
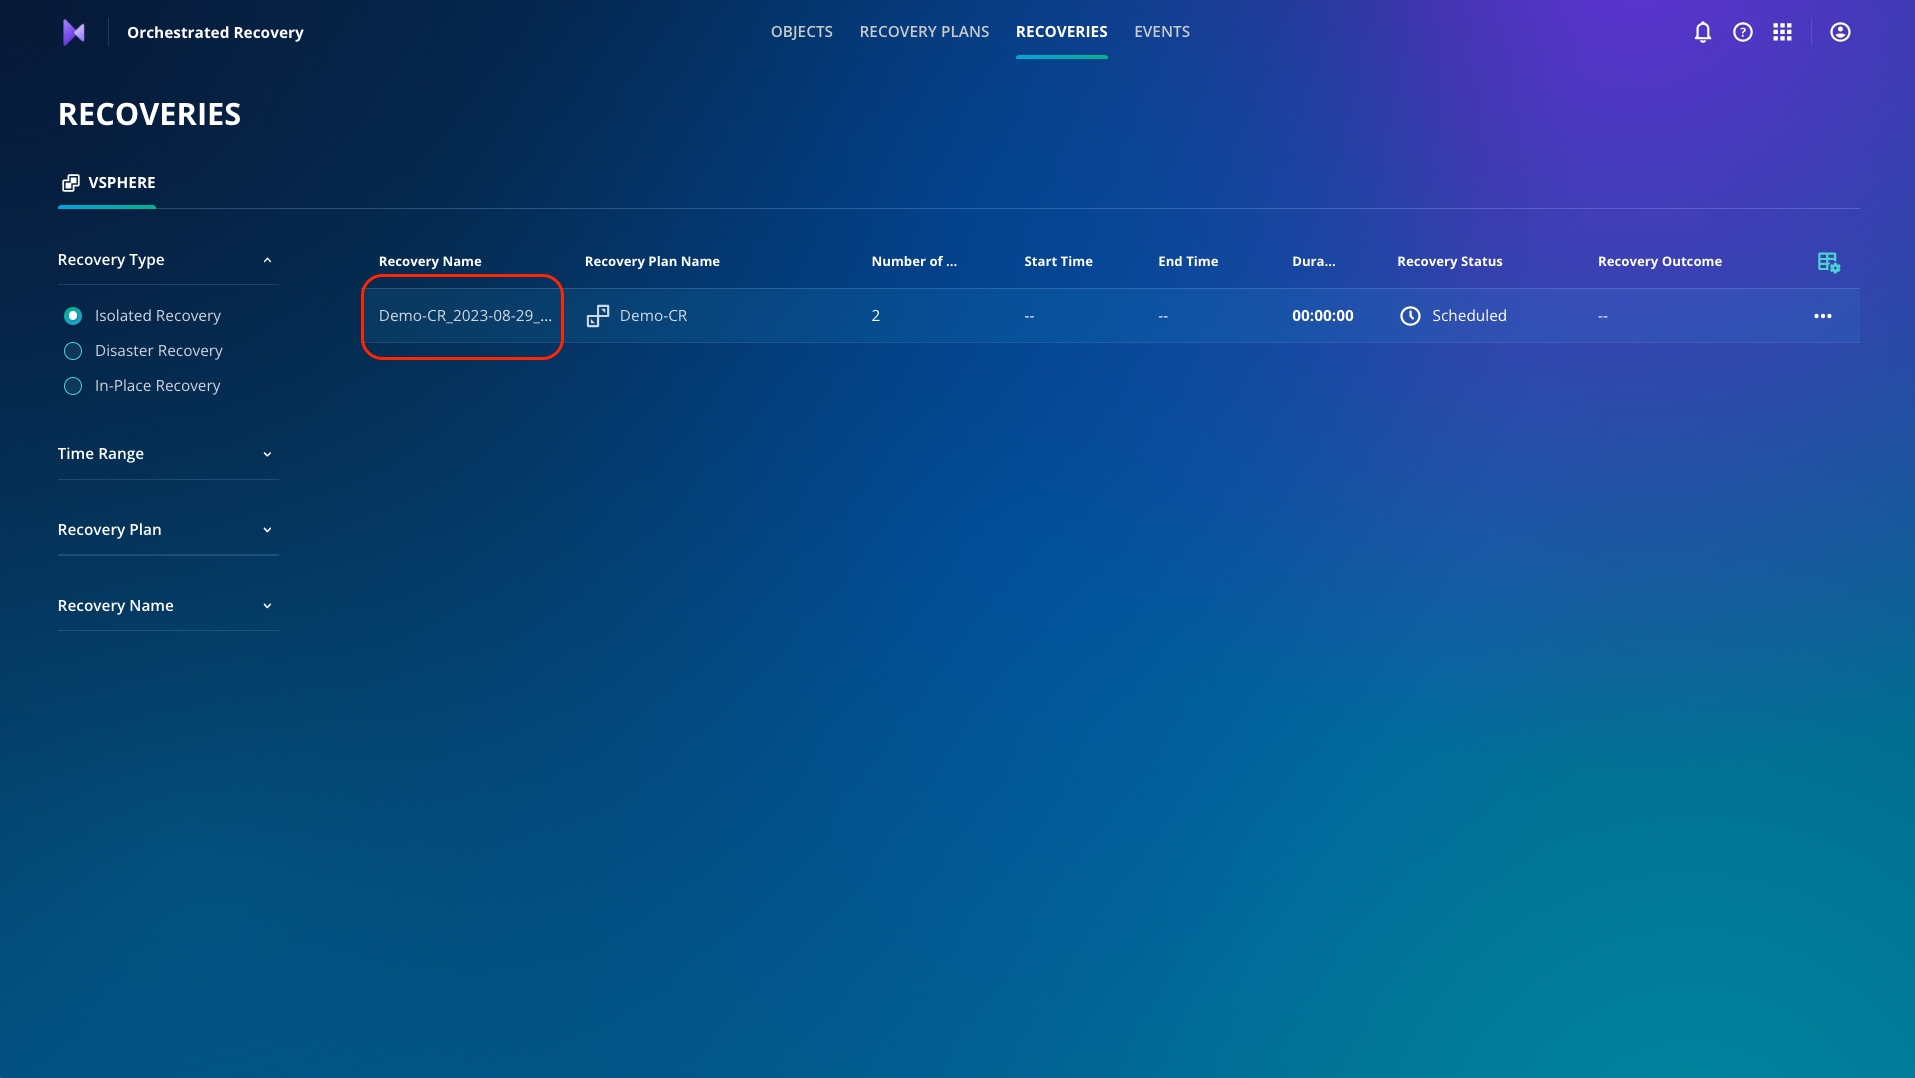
Click Monitor Recovery to see the progress.
Click Demo-CR_* to start monitoring the isolated recovery progress
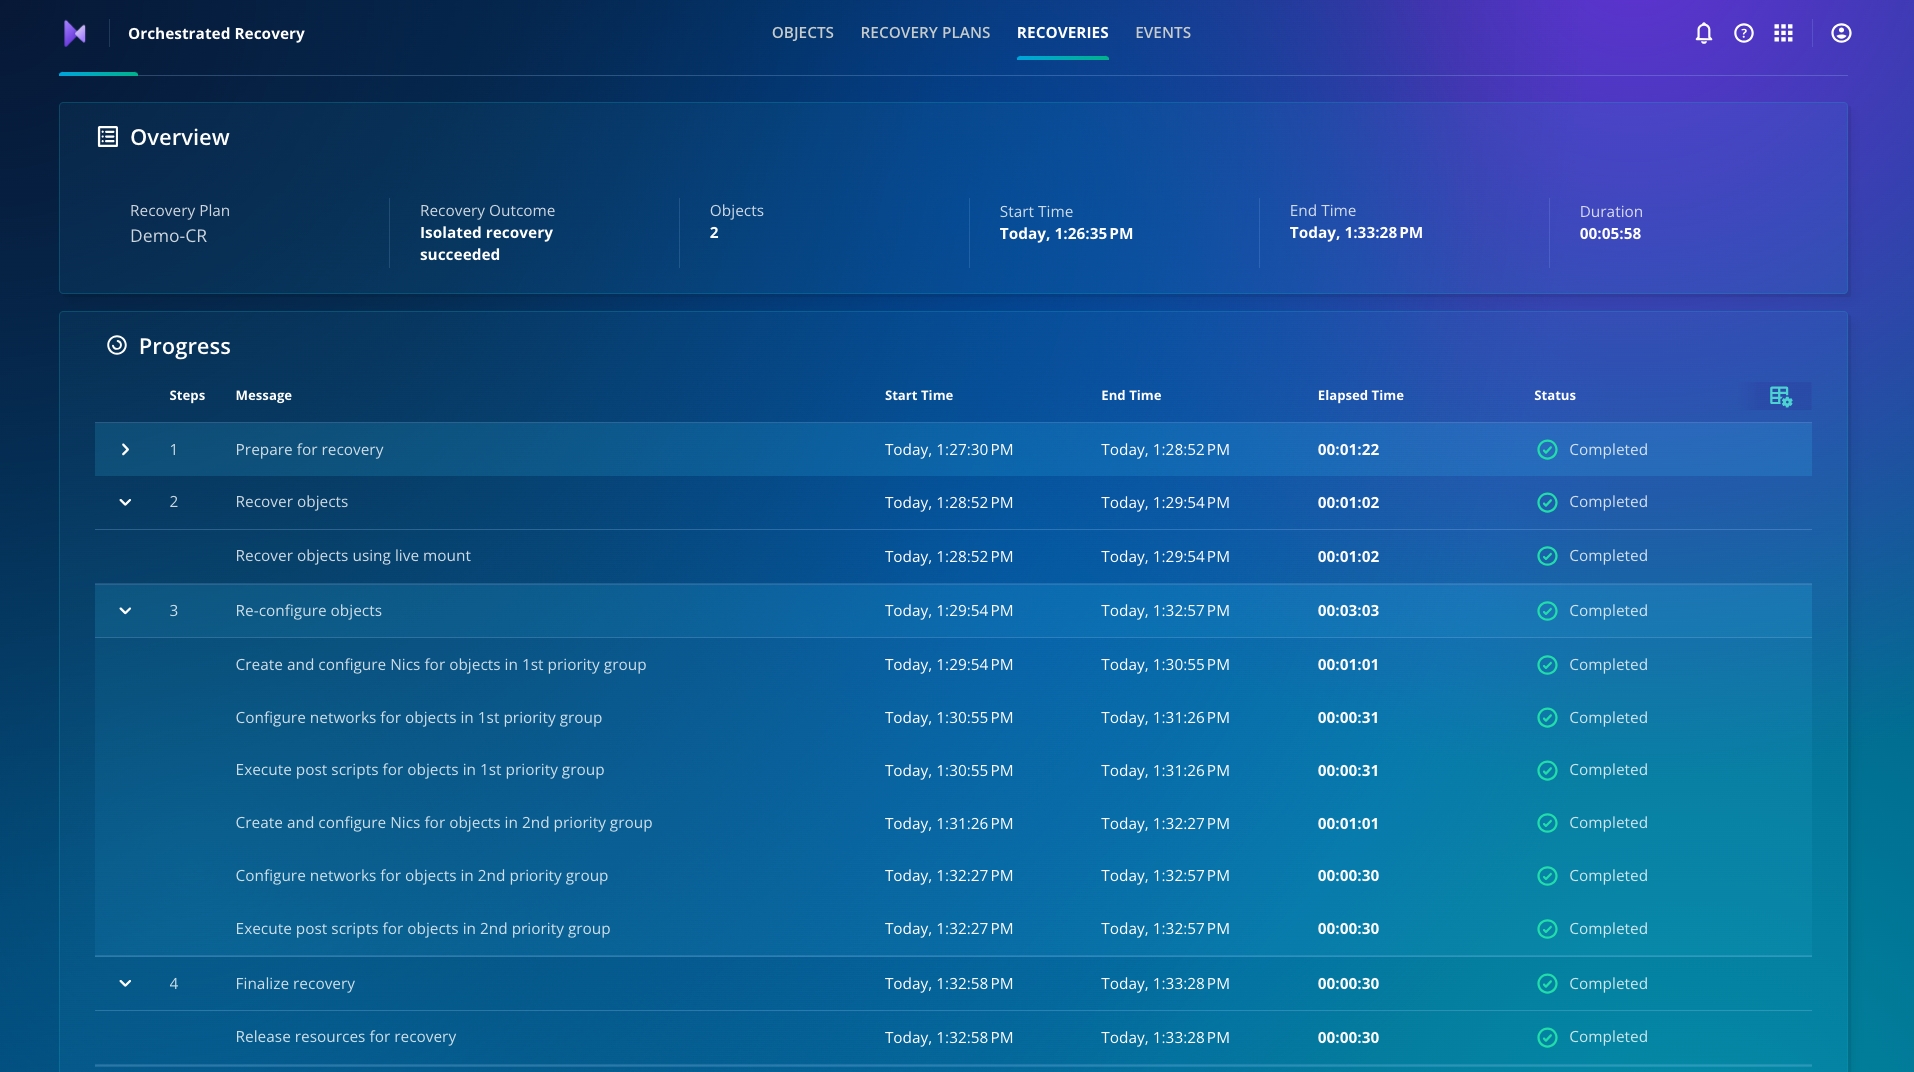
Ensure the recovery is completed without errors.
Congratulations, you have now set up an IRE environment for your team to conduct forensic analysis using anomalous snapshots. You can also validate recovery snapshots by using non-anomalous and non-quarantined snapshots before you recover your production environment!
Using Cyber Recovery and a few clicks, you get an IRE environment up and running within the hour vs. days or weeks!
Click Dashboard on the top left and click Data Security Posture.
You can see that the score is 100.
Now that you have enabled all the clusters to perform Sensitive Data Discovery, you can understand the location of your sensitive data along with who has access to this, especially when determining what data has been exploited during attacks.
Now that you have identified the blast radius, IOCs, and access to sensitive data, the security team is happy with the approach and results. The Director of IT, Aaron has just received an all-clear for initiating the recovery process. Let's hear what he has to say!
Cyber recovery is delivered as a Rubrik Security Cloud-based application. Rubrik Cyber Recovery helps you restore business continuity quickly by effortlessly testing, validating, and orchestrating recovery workflows for business services running in VMware vSphere environments. As a result, IT organizations can eliminate multiple-point solutions and management complexity and avoid unnecessary costs.
If you haven't already connected to the Rubrik Security Cloud, head back to the lab environment.
Once you're logged in, click the app-tray icon in the top right of the user interface, then select Orchestrated Recovery.

So far, you have helped the various teams to detect that there was a cyber-attack taking place, you have looked at some of the options for recovery, you have provided a clean room recovery for digital forensics, and you have pulled the details of sensitive data within the environment for the legal team to begin their compliance efforts. Now, you will look at one of the tools that can really help to tie things together and restore service quickly.
Let's talk about Cyber Recovery.
Cyber Recovery uses the concept of Recovery Plans to bundle together the virtual machines that make an application. Doing this makes it easy to recover the workload without needing to worry about which virtual machines need to be restored and to which point.
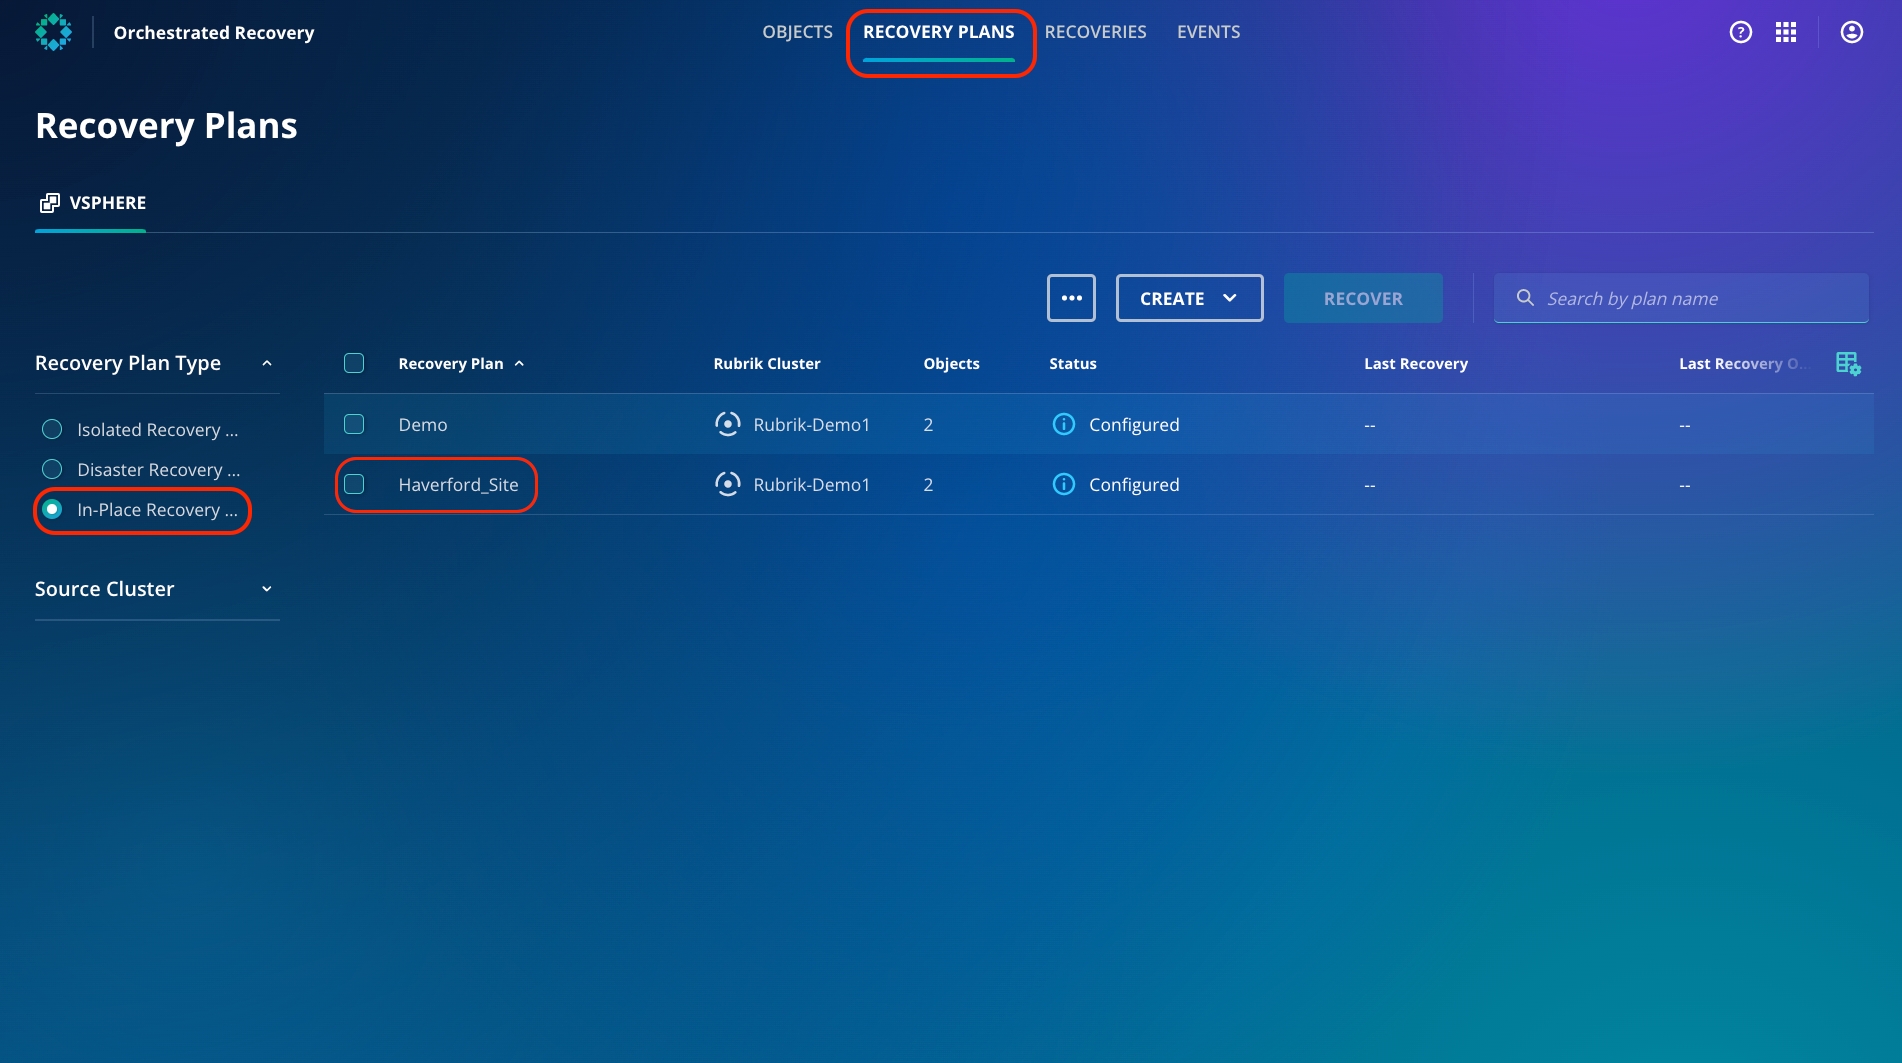
Click the Recovery Plans tab.
From the left panel, select the In-Place Recovery radio button.
You can now access the "Haverford Site" Recovery Plan, which comprises 2 VMs.
You will initiate the in-place recovery next.
Click Platform Security under the overall score. The score is 0 right now. On the right side, you can see all the recommendations to improve the score.
Currently, the recommendation is to enable Multi-Factor Authentication with Time-based One-Time Passwords.
You can also access the Rubrik support article to enable the recommendations as well.

Data Security Command Center (DSCC) is a SaaS service that provides visibility into an organization’s data risks and security gaps, as well as offers recommendations to improve overall security posture. It radically simplifies data risk management by using a single control plane for global visibility and collaboration.
If you haven't already connected to the Rubrik Security Cloud, head back to the lab environment.
Once you're logged in, click the app-tray icon in the top right of the user interface, then select Data Security Command Center.
As you can see, DSCC presents an overall score with 4 pillars: Platform Security, Data Protection and Recovery, Anomaly Detection, and Data Security Posture with individual metrics. The collection of scores across the pillars is combined to provide an overall data security score, serving as a single source of truth for the entire Rubrik data environment.
You can now explore each pillar to understand how to improve the security posture.


Click Dashboard on the top left and click Data Protection and Recovery.
You can see that the score is 51.9. You can also see the recommendations on the right to improve the score.
While Rubrik provides multiple defense layers against attackers, you can now understand that risk management processes aren’t static and must be continuously monitored and reported on to identify and assess risk within the environment.
DSCC doesn't just provide you with a score, it provides actionable insights into how to improve your security posture.


Now that your environment is up and running and you have some insight into the security score let's set up MFA with TOTP for the user to add an additional layer of security to avoid any unauthorized access to the environment.
NOTE: Please download and configure one of the following third-party authenticator applications on your phone to enable a Multi-factor Authentication or two-step verification configuration.
Google Authenticator
Microsoft Authenticator
Okta Authenticator
If you already have one on your phone, feel free to use it by adding a new Organization.
Under the user icon, click User Preferences and navigate to Multi-factor authentication.
Toggle the button to turn on Multi-factor authentication, as it is currently disabled for this user.
Open the Authenticator on your phone and add an Organization or scan a QR code.
Enter the code from your Authenticator app into the Verification Code. Click Continue.
Under the user icon, click Logout. Re-login to RSC, and now you can enter the TOTP as the verification code from your authenticator application.
Rubrik MFA provides an additional authentication security layer. In addition to the username and password, TOTP uses an app to deliver a single-use numeric code as the second authentication factor.


Zaffre Fashion Group, especially their luxury Haverford brand, started the day in a not-so-great place. With the website down, Zaffre was losing money as the clock ticked. By leveraging the applications available to you as a Rubrik Enterprise edition customer, you were able to:
We hope you've enjoyed this lab and learned how Rubrik’s solutions keep your data safe and easy to recover in the face of cyber-attacks and operational failures.


Click Dashboard on the top left and click Anomaly Detection.
You can see that the score is 100.
Now that you have enabled all the clusters to perform the anomaly scan, ransomware and its blast radius can be detected quickly. You can track the score trends based on 1 week, month, or year.
